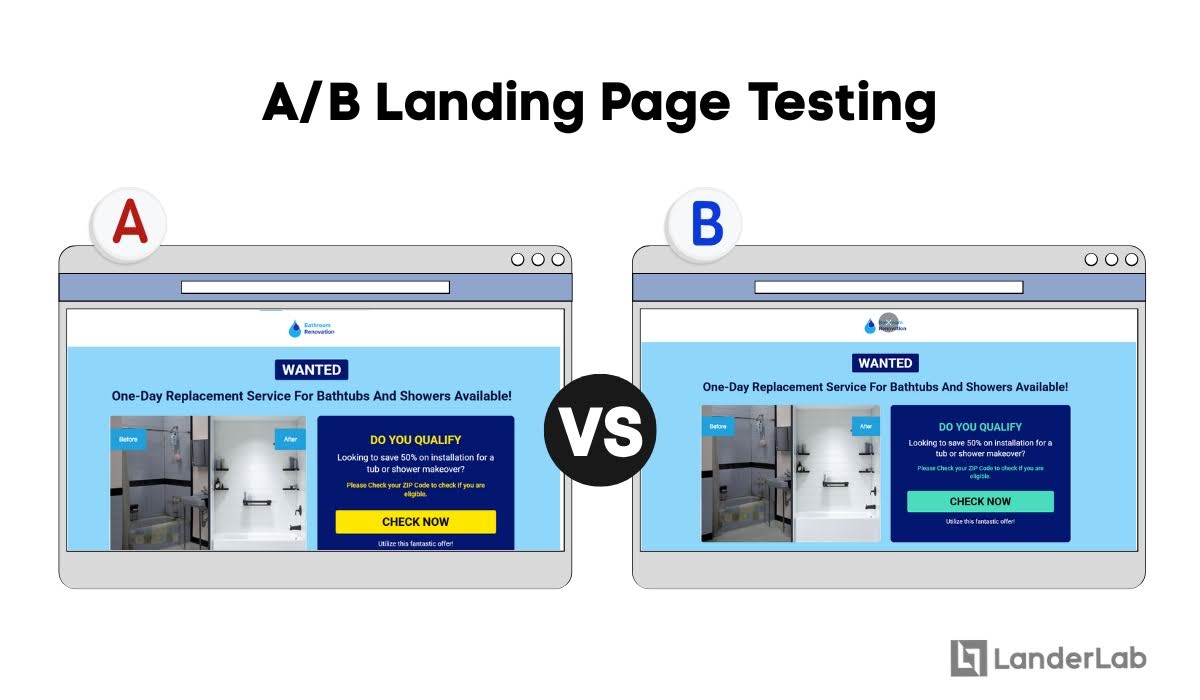
A/B testing your landing pages is one of the most powerful ways to boost your conversion rates and grow your business without guessing what might work.
Instead of debating whether a red button or blue button converts better, A/B testing landing pages lets you show different versions to real page visitors and measure which one actually performs best.
Key Takeaways
- This comprehensive guide walks you through the step-by-step process to start A/B testing your landing pages like a pro, from identifying what to test to implementing winning changes.
- Always establish baseline metrics and form specific hypotheses based on real problems you’ve identified in your current landing page performance, rather than testing random landing page elements.
- Focus on changing just one element per test so you can clearly identify what caused any performance improvements or declines.
- Understand statistical significance to ensure you’re not making business decisions based on potentially random fluctuations.
What is A/B testing?
A/B testing is a controlled experiment where you compare two versions of a webpage to determine which performs better with your audience.
A/B Testing vs Split Testing vs Multivariate Testing
While the terms “A/B testing” and “split testing” are often used interchangeably, A/B testing specifically refers to comparing two page variations (A and B variants) with minor differences.
In contrast, split testing compares two completely different versions of your webpage to see which one gets better page visitor responses. The process involves showing different versions to random segments of your traffic and measuring which generates superior results.
On the other hand, multivariate testing changes multiple variables on your landing page simultaneously to see which combination of changes works best together. Read a more detailed guide about Landing Page Split Testing vs A/B Testing.
A/B Testing Terminology
In landing pages testing, a variant is simply a different version of something you’re testing, like a webpage or email design.
The control is your current or original version, against which you compare everything else—it’s your starting point.
A champion is the version that’s currently performing the best, while a challenger is a new version you’re testing to see if it can beat the champion.
Statistical significance means you can be confident that the differences you see in your test results are real and not just due to random chance. One goal of an A/B test is to achieve statistically significant results.
Why A/B Test Landing Pages?
Landing pages serve as critical conversion points in your marketing funnel, making their optimization essential for business success. Without systematic testing, you’re essentially gambling with your marketing budget and leaving potential revenue on the table.
Strategic testing ensures every element of your page is working toward your business objectives rather than relying on assumptions about what visitors want.
Here’s what else landing page testing can do for your business.
- Boost conversion rates and revenue generation
- Enhanced user experience and engagement
- Maximize return on advertising investment
- Low-risk approach with high potential rewards
- Better audience insights and understanding
- Reduced bounce rate through optimization
- Compound improvements that create exponential results
A/B Testing: Step-by-Step Guide
Now you know the key terminologies and why you’re doing an A/B test for your landing pages, let’s jump into building one, step-by-step!
First things, first. Throughout this guided process, think about A/B Testing as an experiment. In this experiment, consider yourself a researcher, searching for ways to improve your revenue.
Here’s a brief outline of the entire process:
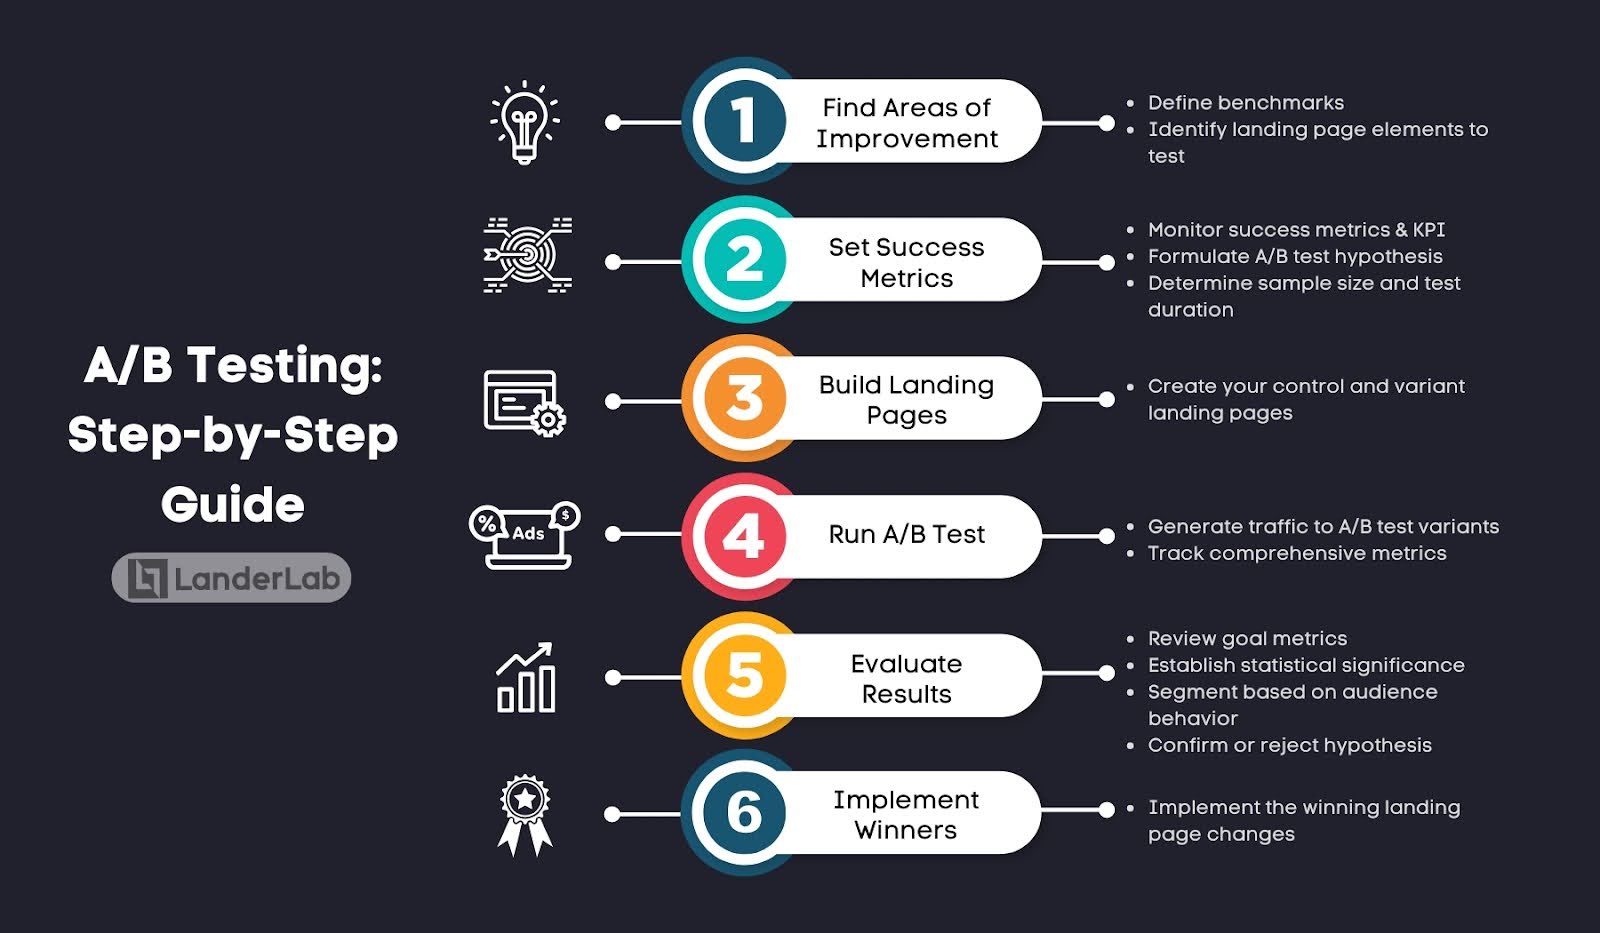
Step 1: Find Areas of Improvement
What pushes an experiment? To find areas of improvement.
In doing an A/B Test, the assumption is that you already have a foundation landing page where you have current data to compare your test to. This is also why testing a page type/style and testing the elements of a page can work in tandem.
You do a split test between two landing pages with the same goals, and then optimize the “winning” page through a series of A/B tests.
Your winning page in the split test then becomes the control version for your A/B test.
Alternatively, you can just pick high-impact pages to test. Here’s how to do that:
- Identify your money pages – checkout, product pages, pricing, sign-up forms
- Check your analytics for pages with high traffic and high business value
- Look for drop-off points – where do people commonly leave your site?
- Start with high converting landing pages that directly affect sales, leads, or sign-ups
- Save low-impact pages for later once you’ve optimized the important stuff
Step 1.a: Define Benchmarks
Without proper baseline measurement, you cannot accurately determine if changes produce meaningful improvements or just random fluctuations.
Start by gathering at least 2-4 weeks of historical data from your current landing page. This gives you a solid foundation to work from. Look at metrics like conversion rates during different times of the day, days of the week, and traffic sources. This helps you understand normal performance patterns before you start testing.
Consider seasonal trends too. If you’re offering home improvements, your baseline from winter months won’t be very helpful for spring testing. Because home improvements usually happen in dry climate conditions. Make sure your benchmark data represents typical performance for your current situation.
Step 1.b: Identify Landing Page Elements as Test Variables
To make it easier, you can actually test any variable on your landing pages.
Want to see if you’ll have better CTR with more visuals? Sure.
Will an arrow icon pointing to the CTA button make more users click? Definitely!
Can a change of color in the background affect how users interact with the pricing section? Test it.
Here are more landing page elements you can test and how each may impact metrics:
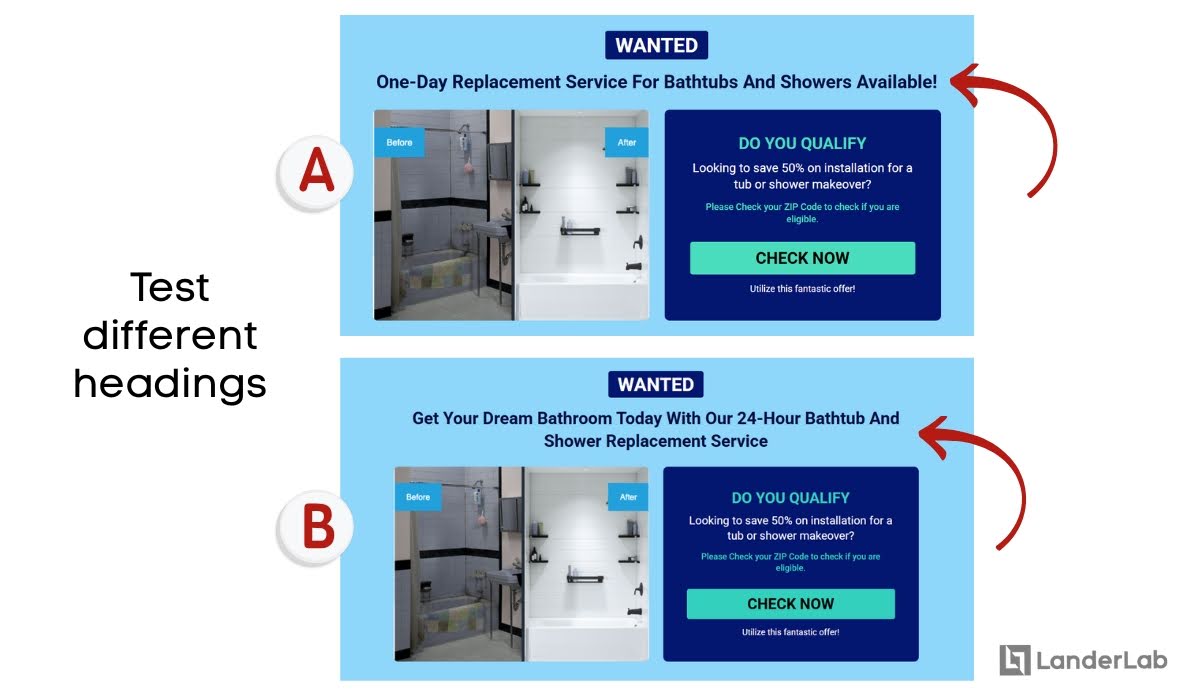
HERO AND HEADLINES
Your headline is often the first thing visitors see and determines whether they’ll continue reading or leave immediately.
Try testing headlines that focus on benefits versus features. For example, “Get More Leads” (benefit) versus “Advanced Lead Generation Software” (feature). You can also test different headline lengths—sometimes a longer headline that explains more converts better than a short, punchy one.
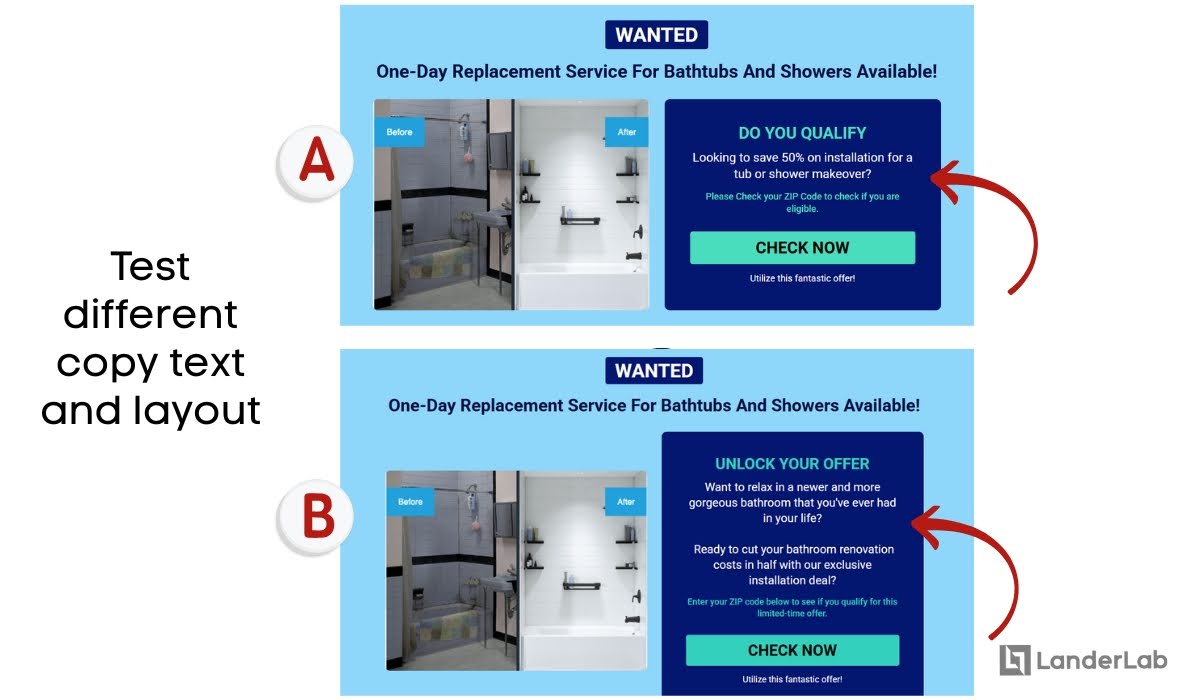
COPY TESTING (SEPARATE FROM HEADLINES)
Copy refers to any other text on the page that is not a headline. You can test for copy structure, such as bullet points, short form, or long form. Variables can also include the voice of the copy, or making complex terms colloquial or straightforward.
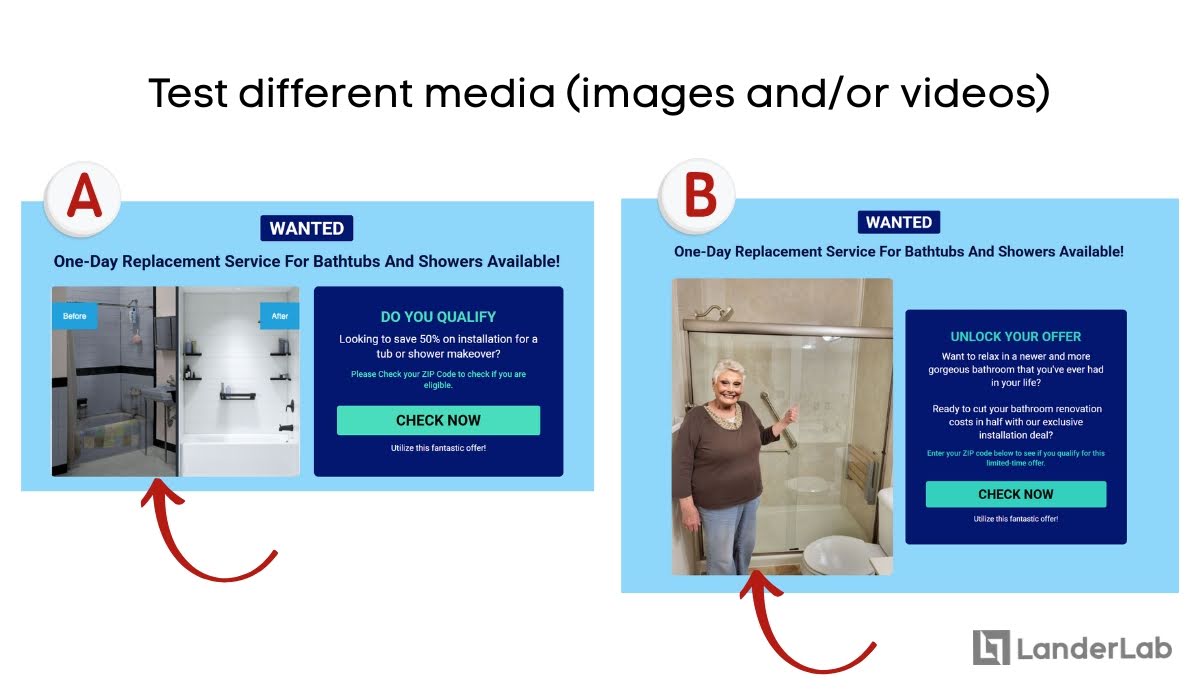
VISUAL CONTENT (IMAGES AND VIDEOS)
Test images with people versus product-only shots. You can also test different image sizes and placements—sometimes a smaller image that doesn’t compete with your headline works better.
Answer questions like: Does adding user-generated product images increase page sessions? Would adding people to the image attract more leads? What images will convey trust and confidence in your products?
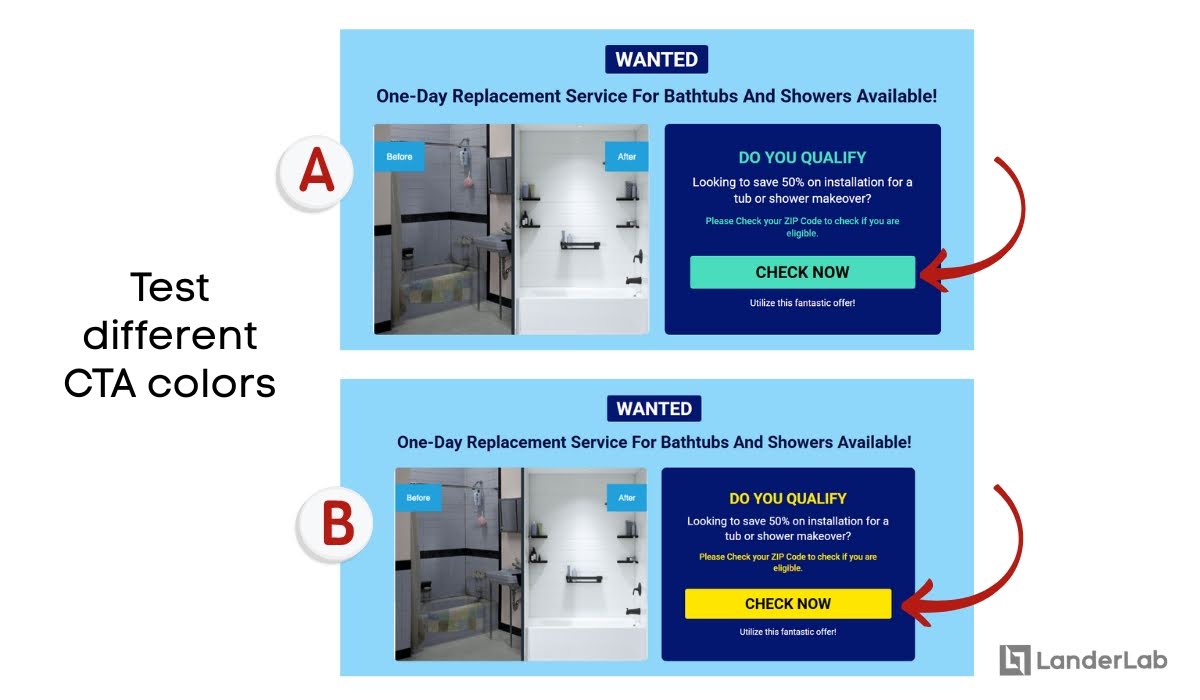
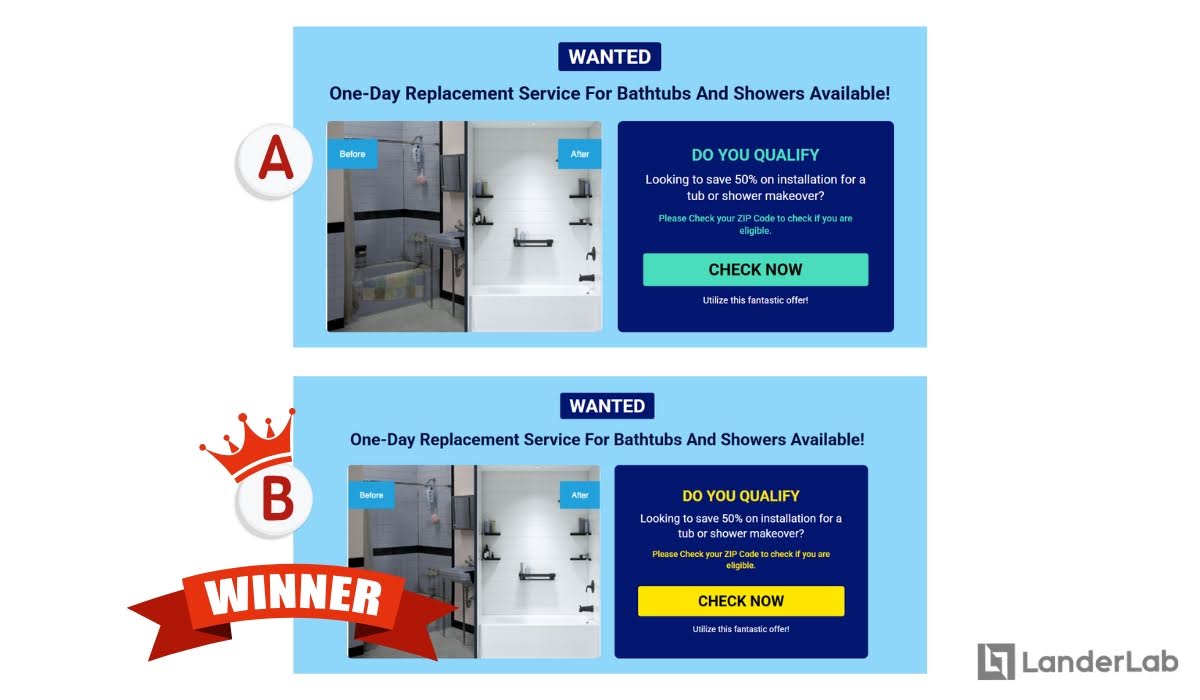
CALL-TO-ACTION BUTTONS AND PLACEMENT
The design, color, text, and position of your CTA buttons directly influence whether visitors take your desired action. Small changes in the landing page’s button color or wording can result in significant conversion improvements. Adding or removing animations can also be tested for visual impact.
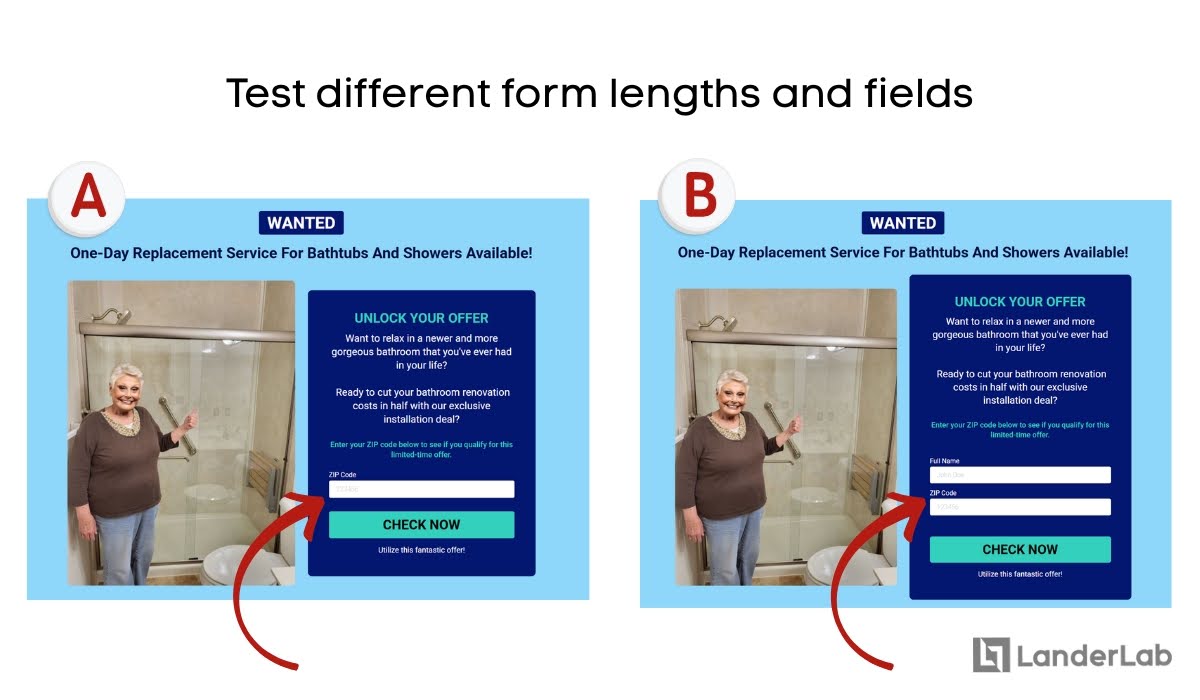
OPT-INS AND FORM FIELDS
Form field requirements, form length, and positioning greatly affect completion rates and lead quality.
Will a simpler versus a more detailed one improve form submissions? How does a longer form affect lead quality? Test asking for just email versus email plus name, or try optional fields that people can skip.
SOCIAL PROOF AND TRUST SIGNALS
The type and presentation of social proof can significantly influence a visitor’s trust in the brand. Testing customer reviews versus expert endorsements reveals what builds confidence most effectively. Will adding trust badges to guarantee information safety increase scroll depth?
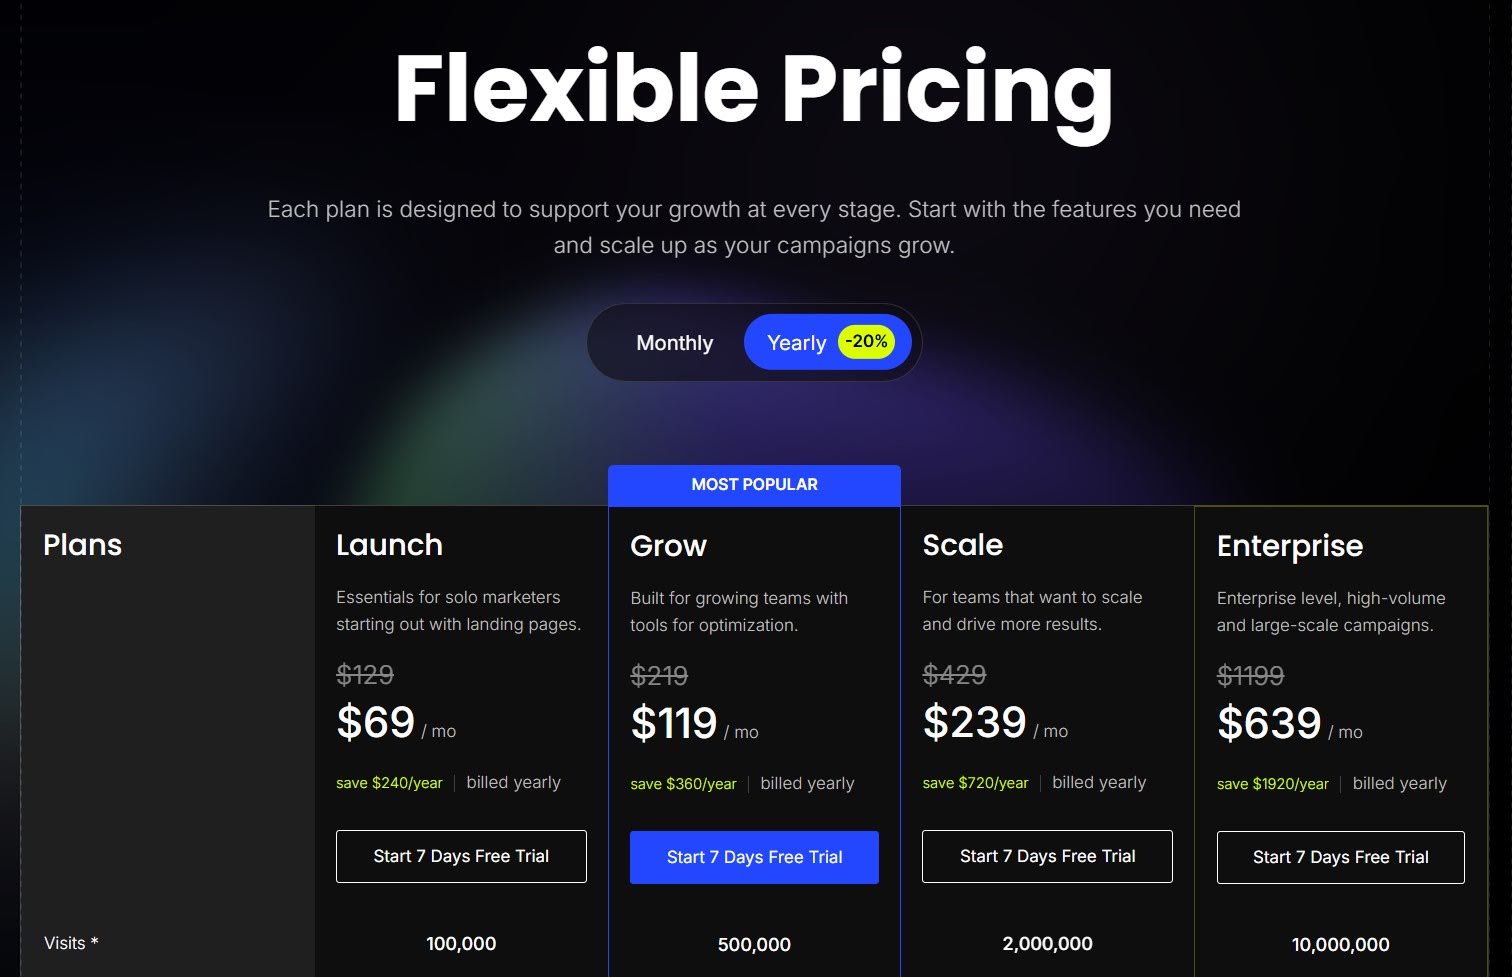
PRICING STRATEGIES AND PRESENTATION
How you display prices, package options, and value propositions directly impacts form submissions. Test showing your price upfront versus revealing it after explaining the value. Some audiences prefer transparency, while others need to understand the benefits first.
You can also test different ways of showing value—monthly versus yearly pricing, or emphasizing cost savings. How will a three-pricing option affect exit rates?
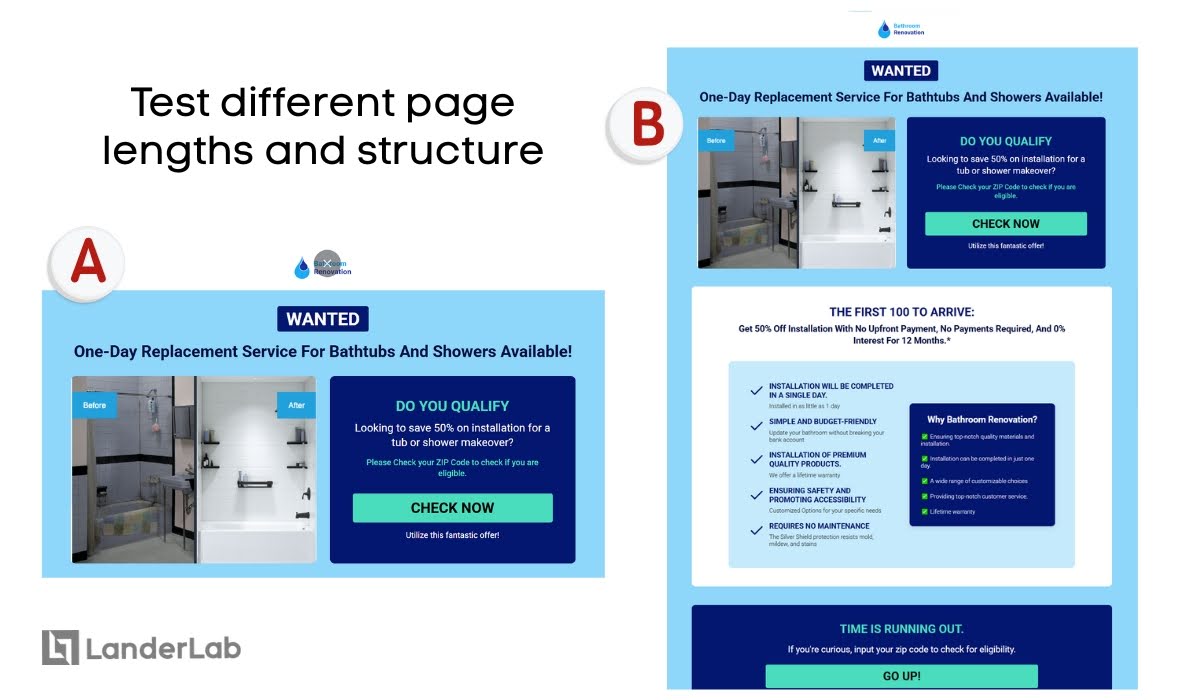
OVERALL PAGE LENGTH AND STRUCTURE/LAYOUT TESTING
The amount and organization of information affect user engagement and conversion patterns. Long, detailed pages versus shorter, focused versions can reveal whether your audience prefers comprehensive information or quick decisions.
The main question to answer to complete the first step of A/B Testing is: What else can we improve in this landing page?
Looking at your benchmarks, successful landing pages, and KPIs, what common problem are you seeing? What’s a high-ticket offer that isn’t utilizing its budget’s full potential? How can we increase high-quality traffic to an already winning page?
Here’s the kicker: This shouldn’t be random. If you can’t think of a reason why you’re testing variables, then why test them?
Here’s an approach you can follow:
- List everything you want to change – Write down all your ideas for improvements
- Pick the most important element – Choose the one change that could have the biggest impact on your main goal
- Create two versions – Keep everything else exactly the same except for that one element
Step 2: Set Success Metrics and Formulate Hypothesis
Your test should be based on a specific hypothesis about why a change might improve your success metrics. And so, we move on to step 2 of the A/B testing process.
Step 2.a: Monitor Success Metrics and KPIs
Before you start testing, you need to decide what success looks like. Your primary metric should align with your business goals.
For most landing pages, this will be the conversion rate, but depending on your goals, you might focus on other metrics. Here are other essential metrics to track for different goals:
For E-commerce sites:
- Click-through rate (initial interest)
- Add-to-cart rate (serious consideration)
- Checkout completion rate (purchase intent)
- Average order value (total impact)
- Return customer rate (long-term value)
For Lead generation:
- Form views (initial interest)
- Form starts (engagement)
- Form completions (conversions)
- Lead quality scores (sales team feedback)
- Cost per qualified lead (efficiency)
For Content sites:
- Click-through rate (initial interest)
- Time on page (engagement)
- Pages per session (exploration)
- Return visitor rate (loyalty)
- Social shares (amplification)
Don’t try to optimize for too many metrics at once. Pick one primary metric that matters most to your business, then watch the secondary metrics to make sure you’re not accidentally hurting other aspects of performance.
Other KPIs to monitor:
- Conversion rate improvements: By how many percent does the conversion rate improve in a specific timeframe
- Revenue per visitor:
- User experience and visitor behavior signals
- Or any of the 30 Most Important Lead Generation Metrics & KPIs
Step 2.b: Formulate the A/B Test Hypothesis
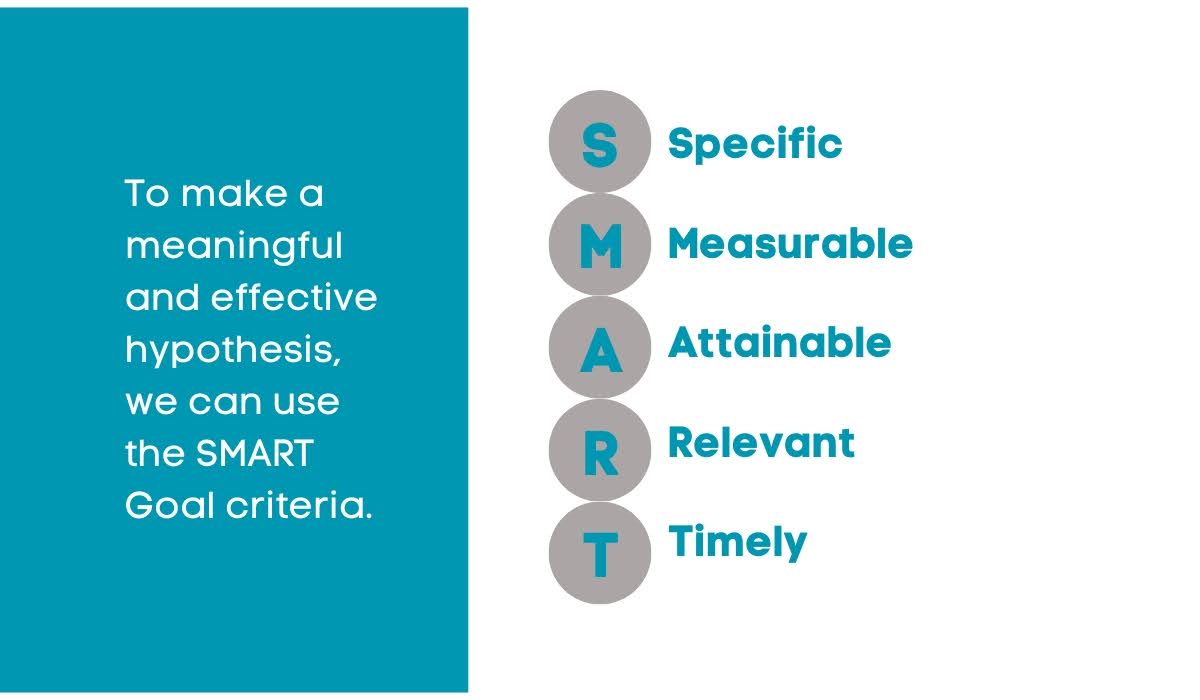
In testing a landing page, a hypothesis should be a S.M.A.R.T. (Specific, Measurable, Attainable, Relevant, and Timely) prediction of how changing any elements will impact your chosen success metrics.
In short, make an educated guess of what will happen in this A/B Test experiment.
This statement identifies the exact variable being tested and forecasts measurable results, enabling you to evaluate whether the changes bring significant improvement or not. The results of the experiment will identify whether to confirm or reject this hypothesis.
So, how do you formulate a S.M.A.R.T. A/B hypothesis?
An effective A/B testing hypothesis contains three essential elements:
- The problem statement: What issue are you trying to solve?
- A proposed solution: What change will you make to address the problem?
- And the predicted results: What outcome do you expect from this change?
The problem statement forms the foundation by identifying your landing page conversion goal and defining what obstacles prevent visitors from achieving that goal. Remember your Step 1.
This requires understanding both what you want users to accomplish and what currently blocks their path to completing an action, establishing the “why” behind your testing initiative.
A good problem statement is specific and based on data.
Instead of saying “The page doesn’t convert well,”
try “Our landing page has a 2% conversion rate, but visitors spend an average of 3 minutes on the page, suggesting they’re interested but something is preventing them from converting.“
Your proposed solution should be directly connected to the problem. If people are spending time on your page but not converting, maybe your call-to-action isn’t clear enough, or your form is too long.
When predicting results, be realistic but specific.
Instead of “this will increase conversions,“
try “changing the CTA button from green to red will increase conversions by 15-20% because red creates more urgency.“
Moreover, as part of your hypothesis, how do you determine the test duration?
Step 2.c: Determine Sample Size and Test Duration
Before launching your test, you need to figure out how many visitors you need and how long to run the experiment. Getting this wrong is one of the biggest mistakes beginners make—they either stop too early or run tests forever without enough traffic.
CALCULATING YOUR SAMPLE SIZE
Your sample size depends on several factors:
- Your current conversion rate
- The minimum improvement you want to detect
- Your desired confidence level (usually 95%)
Here’s a simple way to think about it: if your current conversion rate is 2%, you’ll need more visitors to detect a 0.5% improvement than a 2% improvement. Bigger changes are easier to spot.
- Your baseline conversion rate
- The minimum lift you want to detect (like 20% improvement)
- Your confidence level
SETTING APPROPRIATE CONFIDENCE LEVELS
In a marketing strategy, a 95% confidence level is the standard. This means there’s only a 5% chance your results happened by random luck.
Some companies use 90% for faster decisions, while others require 99% for major changes.
Higher confidence levels require more data and time to achieve. Make sure to choose your confidence level before starting the test.
Quick reference for minimum visitors needed in an A/B Test:
- High-traffic sites (1000+ daily visitors): 1-2 weeks usually enough
- Medium-traffic sites (100-1000 daily): 2-4 weeks typically needed
- Low-traffic sites (under 100 daily): May need 1-3 months for reliable results
For example, if your page converts at 3% and you want to detect a 25% improvement with 95% confidence, you might need around 2,000 visitors per variant.
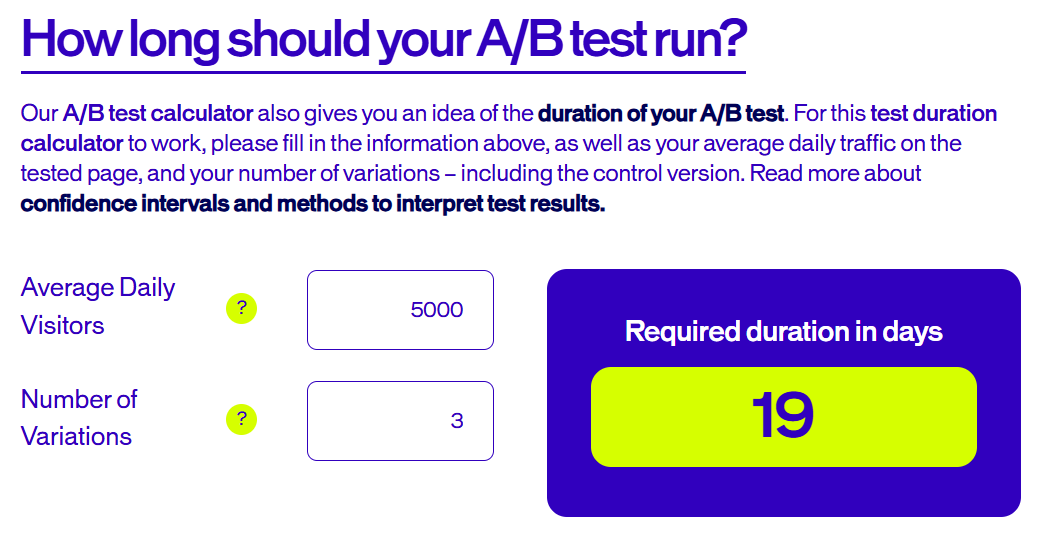
SETTING YOUR TEST DURATION
Once you know your sample size, figure out how long it’ll take to get that many visitors. If you get 500 visitors per day and need 2,000 per variant, your test will take about 8 days (4,000 total visitors ÷ 500 per day).
How to determine the right test duration:
- Start with the minimum – Plan for at least 7 full days to capture weekly patterns
- Consider your business type – B2B companies might need longer since business customers behave differently on weekends
- Account for your traffic patterns – If most visitors come on certain days, make sure your test covers multiple cycles
- Factor in external events – Avoid testing during holidays, sales events, or major news that might affect behavior
- Set the duration upfront and stick to it, even if early results look promising
After all that process, you should now have a complete hypothesis.
Here’s an example of an A/B test hypothesis:
Because our analytics show that 60% of visitors drop off while filling out our 5-field signup form (problem), changing to a 2-field form with just email and name (solution) will increase our conversion rate from 3% to 5% (predicted result) in a 6-week period.
Let’s set aside this hypothesis and start building the experimental subjects—a.k.a. your A/B test landing page variants.
Step 3: Build your Control Landing and Variant Pages
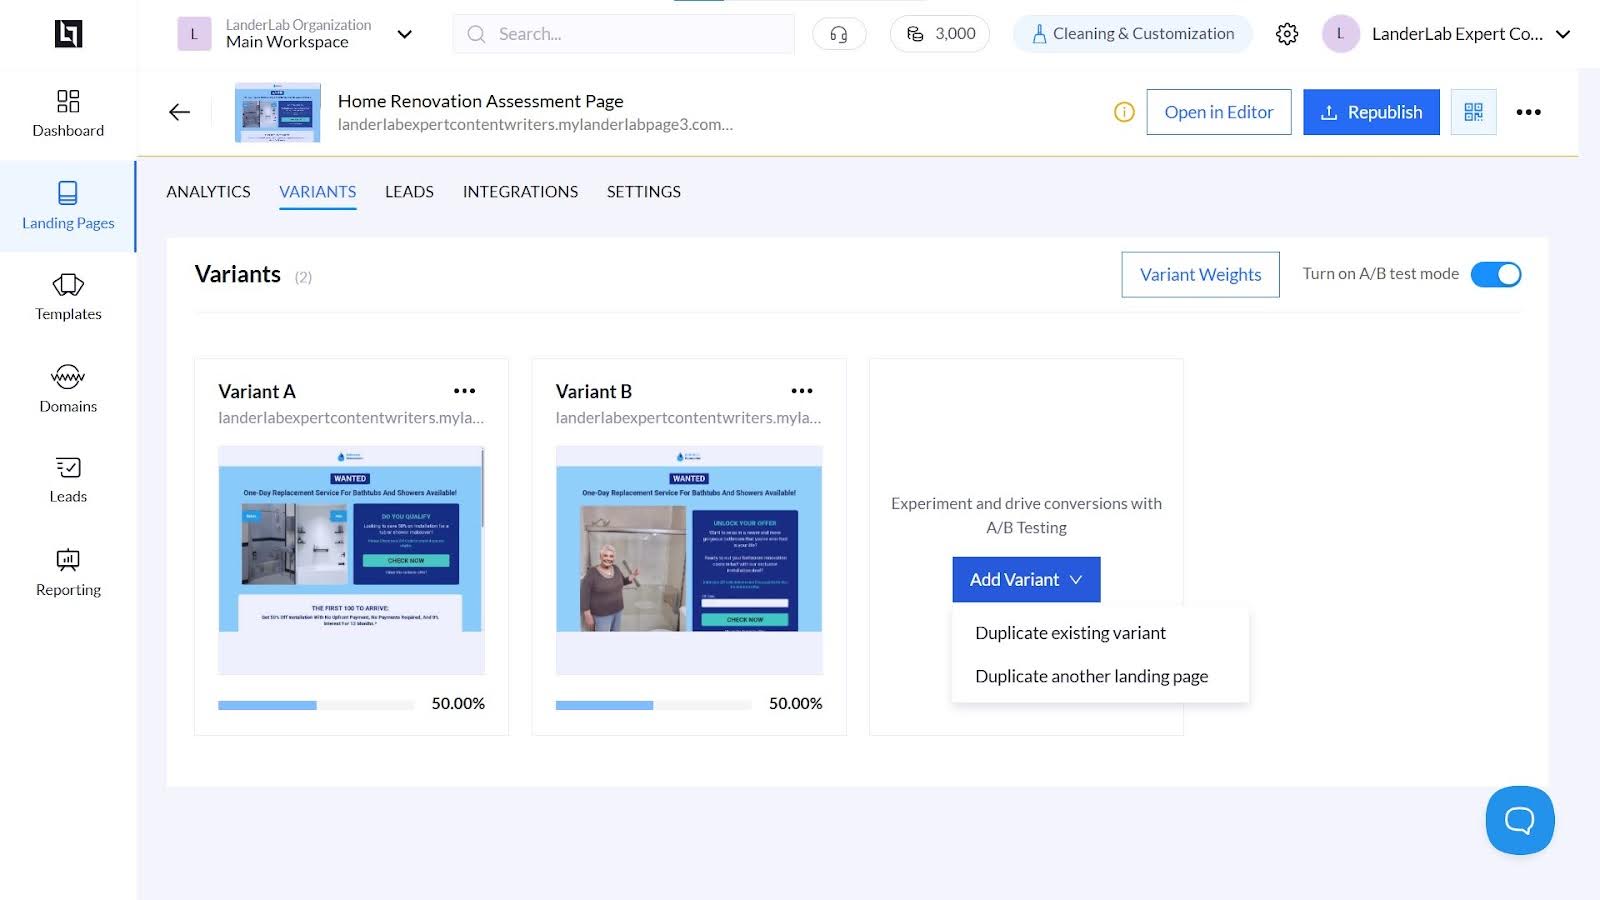
If you haven’t yet, then you should build your base landing page. With a landing page builder like Landerlab, you can instantly build A/B tests on any landing page you’ve created.
For example:
Your control page (Version A) should be your current landing page—the one you’ve been using and have baseline data for. This becomes your benchmark.
Your variant page (Version B) should be identical to your control except for the single element you’re testing. If you’re testing headline copy, everything else—images, buttons, forms, colors—should stay exactly the same.
Here are some practical tips for building your variants:
- Make sure both versions load at the same speed. A slower-loading variant will perform worse regardless of your changes.
- Use a reliable landing page builder that will allow you to easily create variations and save them all in one place. LanderLab helps you clone landing pages and make edits through the drag-and-drop editor.
- Test your pages on different devices and browsers. What looks great on your desktop might be broken on mobile.
- Keep detailed notes about what you changed. You’ll need this information when analyzing results and planning future tests.
- Make sure your tracking is set up correctly before launching. Test the tracking by completing the conversion action yourself on both versions. Landerlab can be integrated with various advertising platforms, making it easier to run tests and redirect traffic flows.
Moreover, plan for the alternative modified versions.
Consider creating multiple variants if you have enough traffic. But remember, more variants mean you need more traffic and time to reach statistical significance. Start with just A and B if you’re new to testing.
Step 4: Run the A/B Test
Now, let’s get those hypotheses back. It’s time to test them!
In running the A/B Test, we’ll keep a single-variable testing. Keep it simple and test one thing at a time.
If you came up with a selection of hypotheses, you can use the ICE framework as a testing strategy to prioritize which to test first:
Impact: How much will this change affect your main metric?
Confidence: How sure are you that this change will work?
Ease: How simple is this change to implement?
Score each from 1-10, then average the scores. Test the highest-scoring hypotheses first.
Got it? Excellent. It’s time to generate traffic for your test pages.
Start A/B Testing Instantly Without Coding
With LanderLab, you can duplicate any landing page, test variations side by side, and uncover what truly converts. No guesswork. Just results.
Step 4.a: Generate Traffic to A/B Test Page Variants
Having enough people see your test is crucial—it’s the difference between asking 5 friends their opinion versus asking 500 people. If only a handful of visitors see each version of your test, the results could be totally random.
You need a solid number of people interacting with both versions before you can trust what the data is telling you. Think of it like a restaurant trying a new menu item—they can’t decide if it’s popular based on just three customers.
Here are general rules to follow when sending generated traffic to your page variants:
- Split your traffic randomly between versions. Most testing tools do this automatically, but if you’re doing it manually, make sure the split is truly random. Don’t send morning traffic to Version A and afternoon traffic to Version B—time of day can affect conversion rates.
- Don’t change your marketing approach during the test, as this could skew results. Promote your landing page the same way you normally would. Use the same traffic sources, ad copy, and promotion strategies you used to gather your baseline data.
- Run your test for at least one full business cycle (usually one week) to account for different behavior patterns throughout the week. Weekend visitors might behave differently from weekday visitors.
- Don’t stop your test early just because you see promising results. Early results can be misleading. Wait until you reach statistical significance.
- Obtain at least 1,000 visitors per variant, but you may need more, depending on your conversion rate. Refer to the A/B test sample size and test duration you came up with from Step 2.c.
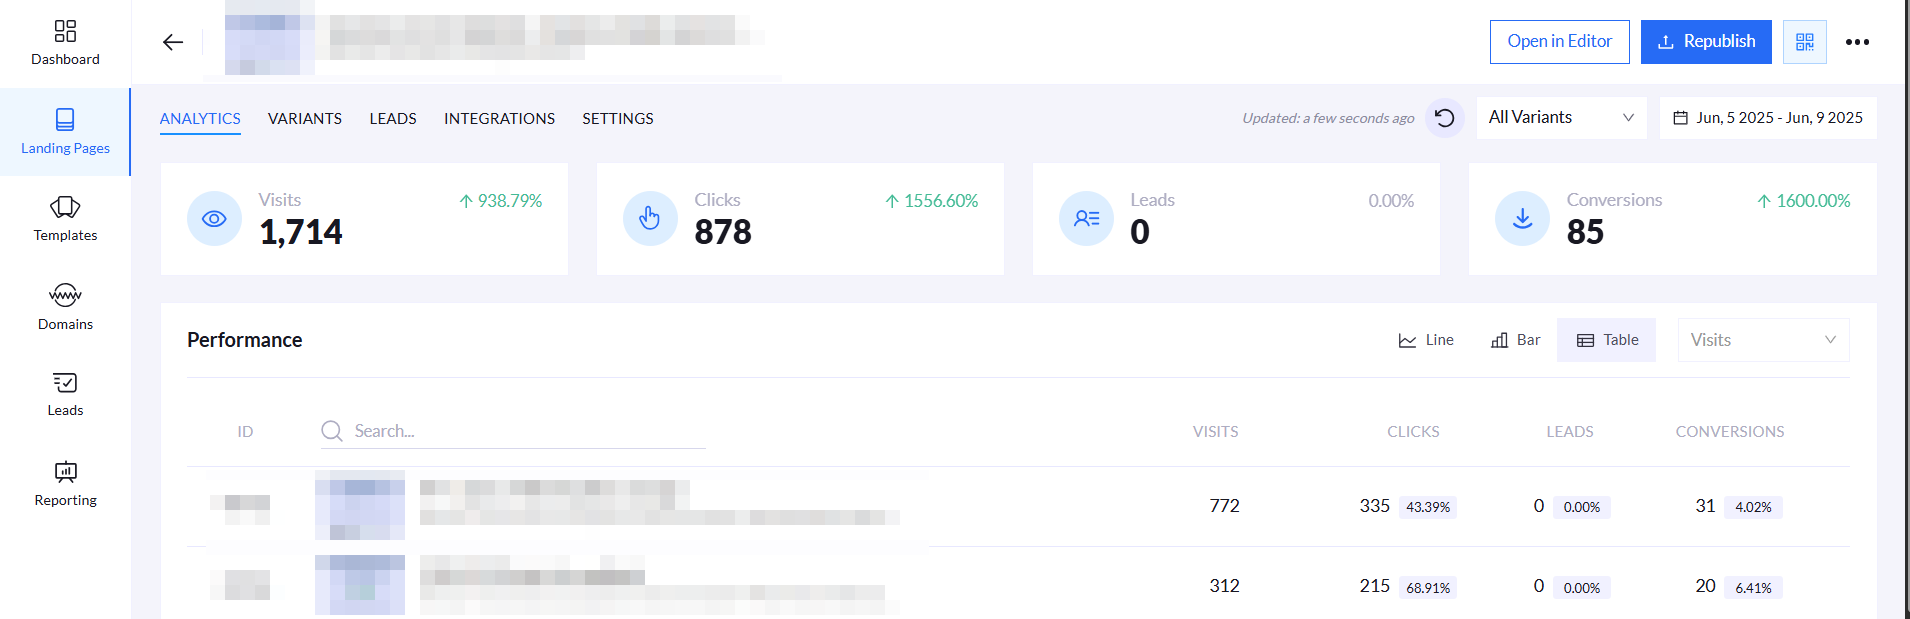
Step 4.b: Track Comprehensive Metrics
Sure, getting more clicks is nice, but what happens after the click? You might get twice as many people clicking your new button, but if none of them buy anything or sign up, that “winning” test is actually a failure.
Look at the whole picture: Are people staying on your site longer? Are they completing purchases? Are they coming back later?
Sometimes, a test that receives fewer clicks can bring in more money or create happier customers in the long run.
Step-by-step approach to comprehensive tracking:
- Start with your main goal (sales, sign-ups, downloads)
- Track the steps leading to that goal (page views, time spent, form starts)
- Monitor what happens after (repeat purchases, customer satisfaction, cancellation rates)
- Compare the total value each version brings, not just the immediate response
![]()
Step 5: Evaluate Results and Confirm/Reject the Hypothesis
So you’ve completed the test run. Congratulations!
It’s time to find out whether your hypothesis is correct or not.
Your test has been running, and now comes the exciting part—figuring out what your data is telling you. This is where many people get tripped up, as they either jump to conclusions too quickly or become overwhelmed by all the numbers.
Let’s walk through how to properly analyze your results step by step:
Step 5.a: Review Goal Metrics
Yes, the one you designed your test around. Is Version B performing better, worse, or about the same as Version A?
Don’t just look at the final numbers. Check the trend over time. Sometimes one modified version starts strong but the other catches up, or performance varies by day of the week.
Look into related metrics that may have changed. Even if your main metric improved, check your secondary metrics. Did you improve the conversion rate but hurt average session duration? Did you get more signups but lower-quality leads?
This is known as the “balloon effect“—sometimes improving one area can cause problems in other areas. You want overall improvement, not just improvement in one isolated metric.
Step 5.b: Establish Statistical Significance
It’s cold, hard quantitative data. Statistical significance tells you whether the difference in results between your test groups is likely due to a specific change or if it was just a random occurrence.
Without statistical significance, you’re making business decisions based on potentially random fluctuations. This is crucial for landing pages where conversion changes directly impact revenue and business goals.
You have to learn how to recognize when your test results are statistically valid. Use a statistical significance calculator—don’t try to eyeball it.
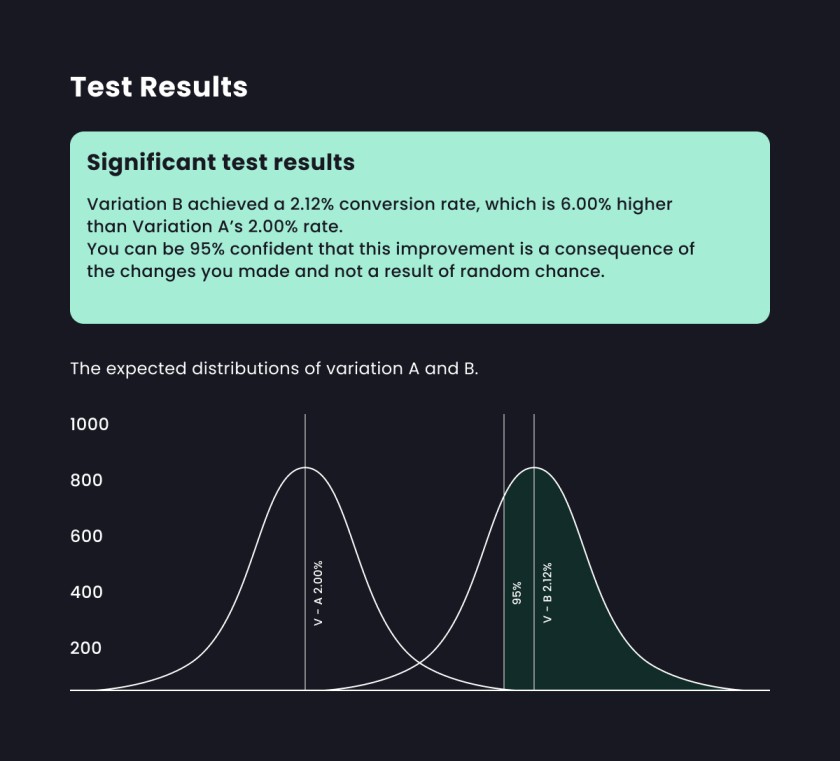
Look for both statistical significance AND practical significance. A statistically significant 0.1% improvement might not be worth implementing if it’s too small to matter for your business.
Step 5.c: Segment Based on Audience Behavior
Not all your visitors are the same, so why treat them that way? A test that works great for new visitors might flop with returning customers. Mobile users might behave completely differently than desktop users.
By breaking down your results into different groups—like age, location, device type, or how they found your site—you can discover patterns that would otherwise be hidden. It’s like realizing that your morning customers prefer coffee while your afternoon crowd wants smoothies.
How to segment your A/B test results effectively:
- Identify your key audience groups before starting the test
- New vs. returning visitors
- Mobile vs. desktop users
- Different traffic sources (social media, search, email)
- Geographic locations
- Age groups or demographics
- Set up tracking for each segment from the beginning
- Run the test long enough to get meaningful data for each group
- Analyze results separately for each segment
- Create different solutions for different groups if needed
Example of evaluating results from a segmented audience:
- Overall test result: Version B wins by 10%
- When segmented: Version B wins 25% with mobile users but loses 15% with desktop users
- Action: Use Version B for mobile, keep the original version for desktop
Step 5.d: Confirm or Reject Hypothesis
Think of this step like being a detective. You’ve gathered evidence (your test data), and now you need to piece together what happened. Did your hypothesis prove correct? Did something unexpected occur? What can you learn for future tests?
The key here is being objective. Perhaps you were really excited about that bright red button, but if the data shows the blue one performed better, the data wins. Your personal preferences don’t matter—only what works for your audience.
Based on your results, was your hypothesis correct? This isn’t just about whether Version B won—it’s about whether the results match your prediction.
If Version B won but for different reasons than you predicted, that’s valuable learning for future tests.
Evaluate Qualitative Results
Every test should generate ideas for future tests. What did you learn about your audience? What other elements might be worth testing based on these results?
Keep a running list of test ideas. Even failed tests often reveal insights that lead to successful future tests.
Step 6: Implement the Winning Landing Page Changes
Once you have a clear winner with statistical significance, it’s time to make the change permanent (or semi-permanent). You now have a new champion page.
But don’t just implement the change and forget about it. Sometimes test results don’t persist in the real world due to factors you didn’t account for.
Continue to monitor performance to ensure the improvement is sustained over time. At some point, test a challenger page.
Document what you learned and share it with your team. What insights about your audience can be applied to other pages or campaigns?
Update your baseline metrics with the new performance levels. Your winning variation now becomes the new control for future tests.
Consider the practical aspects of implementation. If you tested a major design change, make sure you have the resources to implement it properly across all relevant pages.
BONUS STEP: Run it Again! (and Again!)
Think of testing landing pages like staying in shape—you can’t just work out once and expect to be fit forever. Many businesses run one test, pick a winner, and then forget about testing for months.
But your audience changes, seasons affect behavior, and competitors influence what works. What performed great in January might bomb in July.
Maintain continuous testing rather than a one-off experiment. Here’s how to build a continuous testing habit:
- Create a testing calendar – Plan out what you’ll test each month, just like you’d plan content or marketing campaigns
- Start a list of test ideas – Every time someone suggests a change or you notice something odd about user behavior, write it down as a potential test
- Set up a rotation system – After one test ends, have the next one ready to launch within a week
- Review and learn regularly – Schedule monthly meetings to discuss what you learned and what to test next
- Test different parts of your business – Don’t just focus on your homepage; test emails, checkout pages, product descriptions, and customer service approaches
Monthly landing page A/B testing calendar example:
Month 1: Test headline page variations
Month 2: Test email subject line approaches
Month 3: Test product page layouts
Month 4: Test checkout process improvements
Month 5: Test customer service response templates
Month 6: Re-test homepage with new seasonal messaging
Setting up your testing rotation:
- Week 1: Analyze results from the previous test and plan the next test
- Week 2: Set up and launch new test
- Weeks 3-4: Let the test run while monitoring for any technical issues
- Week 5: Analyze results and implement the winner
- Repeat the cycle
The goal isn’t to test everything at once, but to always have something running so you’re constantly learning and improving.
Common Mistakes That Kill Testing Success
Even when following these best practices, many businesses still struggle with testing landing pages. Here are the most common mistakes to avoid:
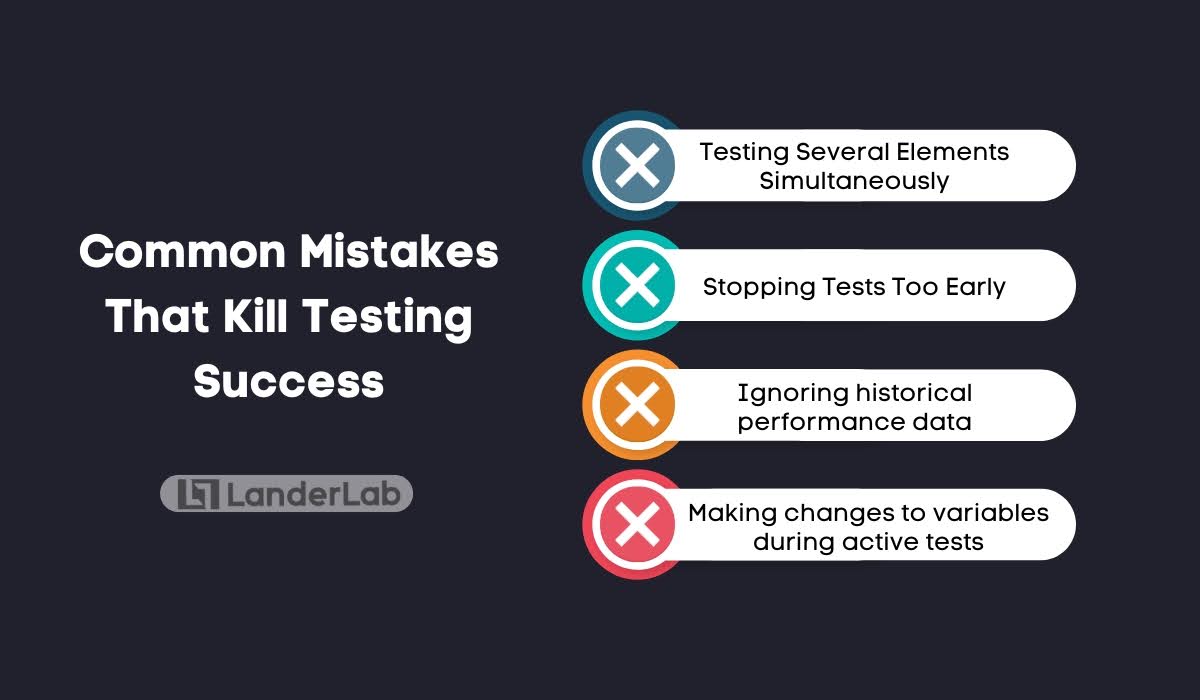
Testing multiple elements at once
Stick to one variable per test, no matter how tempting it is to change everything. Testing multiple variables at once will skew results. Testing multiple variations at the same time can also tend to be confusing.
Stopping tests too early
Allow adequate time for statistically valid results. Let tests run for the full planned duration, even if results look obvious.
Testing low-impact pages
Focus on pages that directly affect your main business goals first. Testing the font color on your “About Us” page probably won’t move the needle much for your business. Meanwhile, your checkout page or main product page could have huge impacts with small changes.
Ignoring historical performance data
Your website has a story to tell through past data, but many people ignore it when setting up tests. Maybe your checkout page has a 15% abandonment rate, or your email signup form converts at 3%. This historical data helps you set realistic expectations and catch unusual results.
Making changes to variables during active tests
Once your test is running, resist the urge to “just make one small tweak.” Maybe you notice a typo or want to adjust the button size slightly. But any change invalidates your results because now you’re not comparing apples to apples anymore.
Getting Started with Landing Page A/B Test
Remember, successful testing is about building long-term knowledge about your audience, not just finding quick wins.
The businesses that see the biggest benefits from testing are those that treat it as an ongoing process of learning and improvement, not a one-time fix
Start with this 6-step process, be patient with the process, and you’ll develop insights that give you a lasting competitive advantage.
Ready to improve conversions? Get started with Landerlab and start conducting A/B Tests on your landing pages today!
Your Best-Performing Page Is One Test Away
You’ve seen what A/B testing can unlock; now put it into action. Build, test, and optimize every landing page with zero technical hassle using LanderLab.


