In a world run by numbers, metrics are crucial in measuring success. So let’s get this one thing straight: The most important lead generation metrics and key performance indicators (KPIs) are the ones that will measure your goals. Identifying why you’re tracking those data will be the key to improving your campaigns.
In this article, we’ll examine the importance of tracking lead generation campaigns, list the most important lead generation metrics and KPIs to choose from, and identify what to measure for your business.
Jump to Section:
🚀 KEY TAKEAWAYS
- We’ll discuss 30 metrics that can serve as your lead generation KPIs, from basic ones like Traffic Volume and Views to more complex ones like Lead Velocity Rate (LVR) and Average Revenue per Customer (ARPC).
- It is crucial to track lead generation marketing to get direct insights about marketing performance, consumer behavior, and potential revenue.
- Leads are not made equal, so it’s always important to qualify which to focus on.
Why Track Lead Generation Campaigns?
Tracking marketing campaigns in lead generation is important because it shows you which strategies work best at bringing in and converting possible customers.
For example, finding a clear link between lead generation KPIs and return on investment (ROI) will help guide goals toward smart use of resources. Critical metrics like conversion rates, cost per lead, and lead quality score offer nuanced insights into marketing efficiency and customer acquisition.
Lead-to-customer ratio and customer lifetime value put tangible value to sales campaigns. With this, stakeholders can back up their decision-making with data-driven insights.
Here’s how monitoring your campaign performance metrics can help your lead generation efforts:
- Gain insights into marketing performance;
- Refine targeting strategies;
- Qualify leads according to segments;
- Provide a clear framework on which strategies boost revenue.
- Maximize marketing budget
- Establish marketing kpi benchmarks
- Build A/B testing to optimize marketing funnels
- Predict acquisition costs
Implementing lead generation key performance indicators requires a dynamic approach combining quantitative analysis and strategic thinking. Successful businesses develop comprehensive KPI dashboards that adapt to changing market conditions and customer behaviors.
This involves creating custom performance tracking systems, setting realistic goals, and staying flexible in how you interpret metrics. By using lead generation metrics as a strategic tool, companies can keep improving their ability to attract, engage, and convert possible customers.
30 Most Important Lead Generation Metrics & KPIs to Consider
Now that we understand why tracking lead generation metrics matters, let’s look at the specific KPIs that can change your marketing approach. The following are the most important KPIs, organized into 8 categories.
Build Smarter Landing Pages, Track Better Metrics
Your metrics are only as good as your landing pages. Use LanderLab to create high-converting pages, track performance in real-time, and turn traffic into qualified leads — no coding required.
We want to be more specific in presenting these metrics, so we’ll refer to these metrics in the context of lead generation. This will offer a comprehensive look into what to measure in your lead generation marketing and sales efforts.
Website Performance Metrics
Tracks how visitors interact with and navigate your website. These metrics help understand online visitor behavior and potential areas for optimization. They also provide insights into effectiveness and user experience.
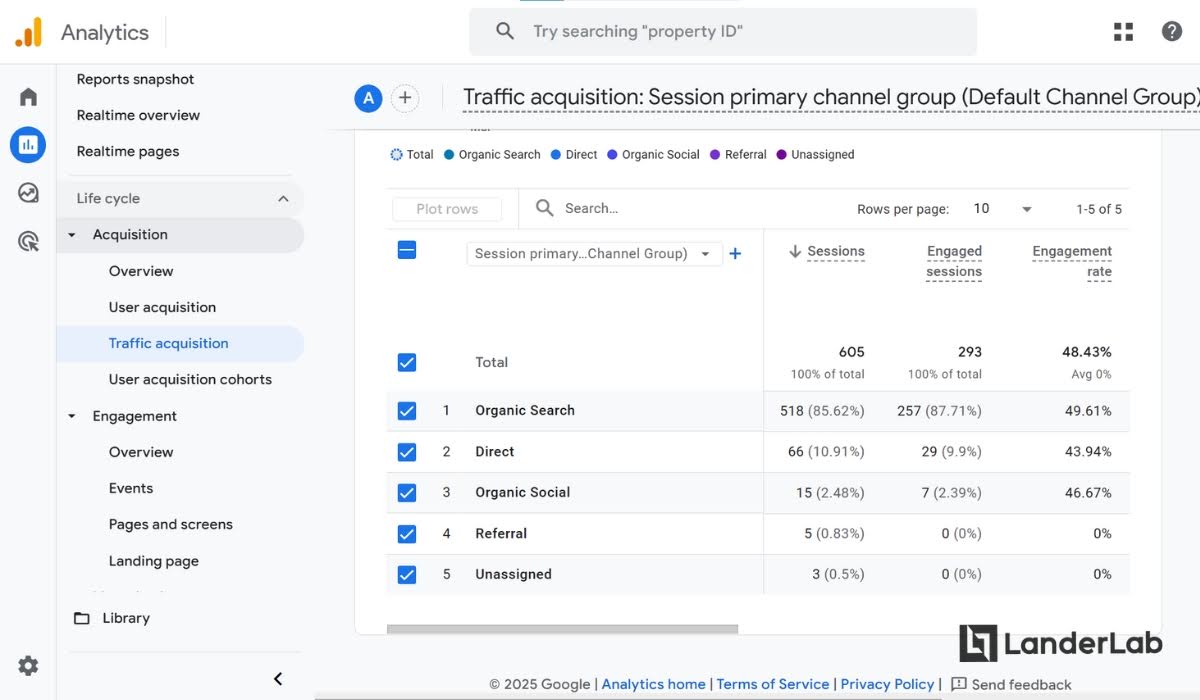
Traffic refers to the volume of visitors to a website or landing page. To set it up, you can configure Google Analytics or similar analytics tools to track visitors from all sources, set up custom segments to differentiate between new and returning visitors, and implement UTM parameters for all marketing campaigns to attribute traffic sources accurately. Landerlab makes it easy to integrate this with your pages.
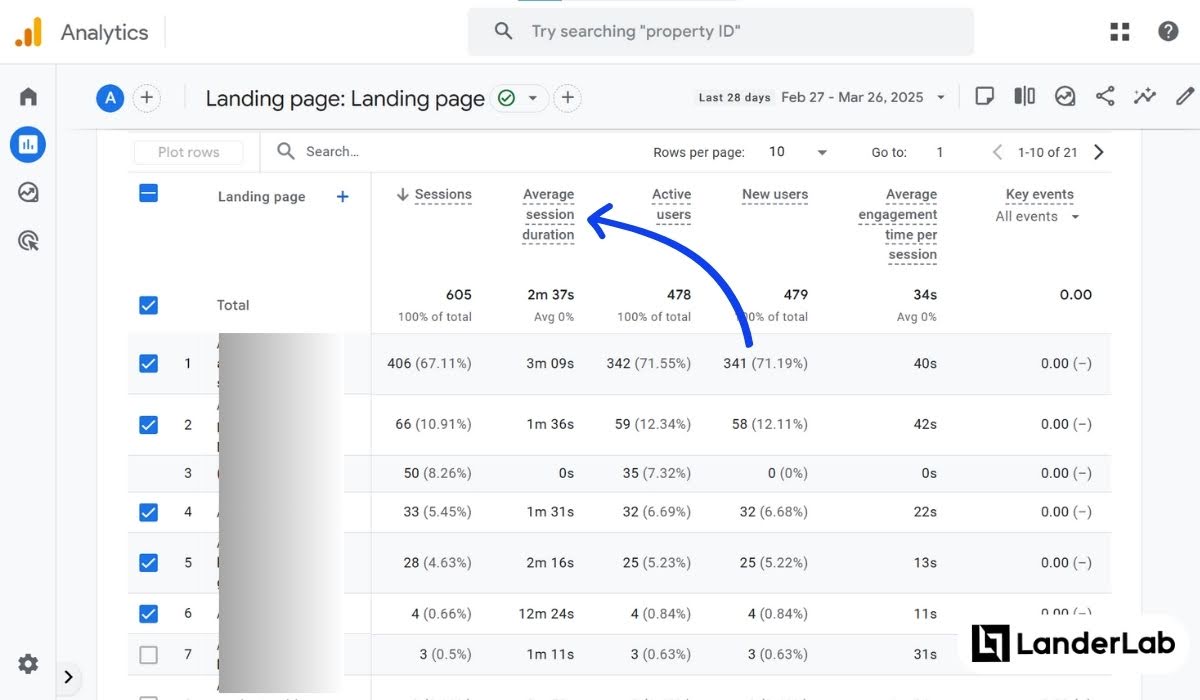
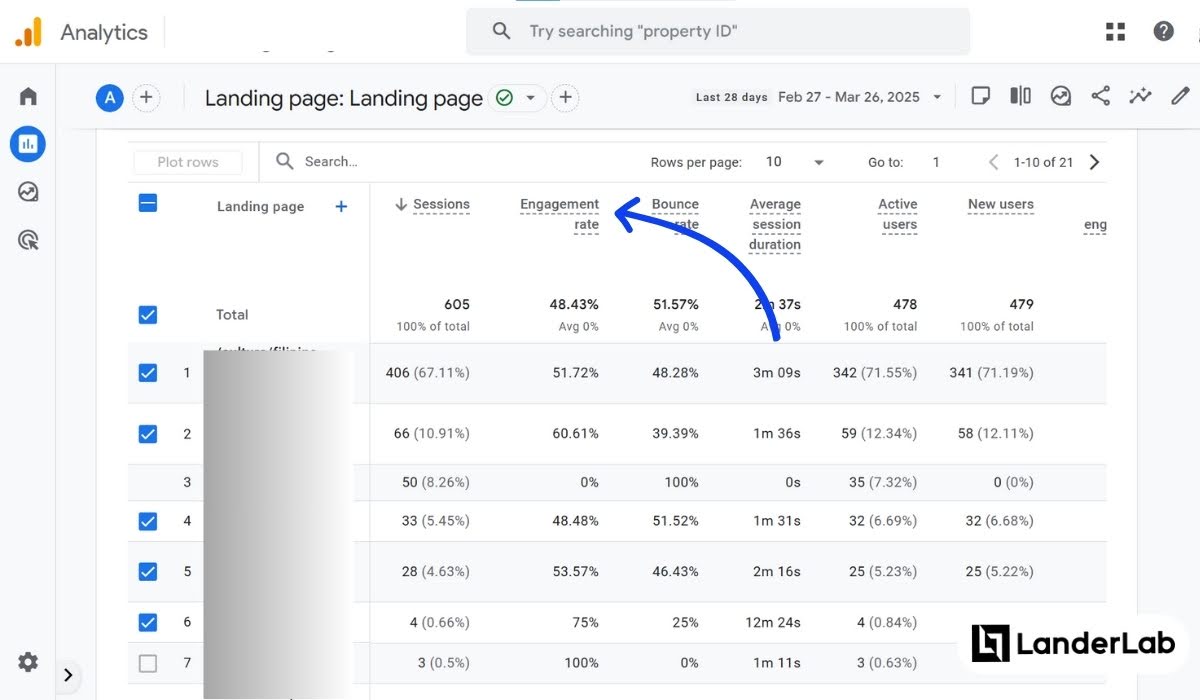
Average session duration measures how long visitors stay on your site. With Google Analytics 4 (GA4), this metric became more of an engagement metric, but other web tracking tools still use it. Some allow setting up scroll depth tracking to understand content engagement and compare session duration across different traffic sources.
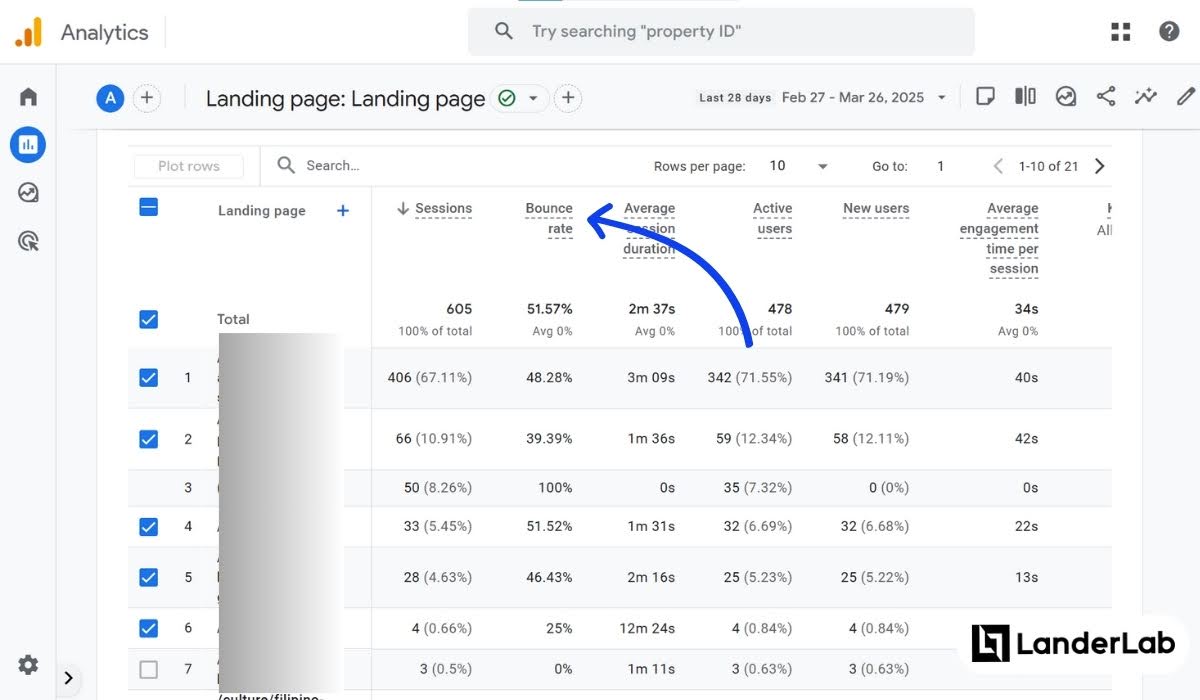
Bounce rate refers to the percentage of visitors who leave a website after viewing only one page without taking any action. It shows the number of single-page sessions where users don’t go further on your site. A high bounce rate often means visitors didn’t find what they were looking for or the page wasn’t interesting enough to them.
Engagement Metrics
Engagement refers to how potential leads interact with your content across various platforms. These metrics reveal your lead capture pages’ level of interest and effectiveness in capturing audience attention.
In lead generation, impressions represent the number of times your content or ad is shown to possible users, regardless of whether they actually see it and click on it, or not.
Since impressions are the first step in how users interact with your content, this metric helps you see how visible your content is and how many people it might reach across different online platforms. Google Search Console tracks this metric, which is also important in PPC campaigns.
Views refer to the number of times a specific page or piece of content is loaded, which can include multiple views by the same user. This gives you a more detailed metric that shows which specific content attracts users and which pages most interest possible leads. This can also reveal user engagement patterns within your website.
The lead saw your ad, viewed the page, and now engages with your content. The engagement rate measures how visitors interact with your content. GA4 has made this even more specific by measuring the average engagement time per active user in a period.
Before tracking this KPI, assess what passes to your business as engagement.
Consider meaningful events such as clicks, form submissions, or video plays. Heat mapping tools like Hotjar help visualize user behavior on a page to create tailored engagement tracking for your brand. These tools combine multiple interaction points to measure user engagement.
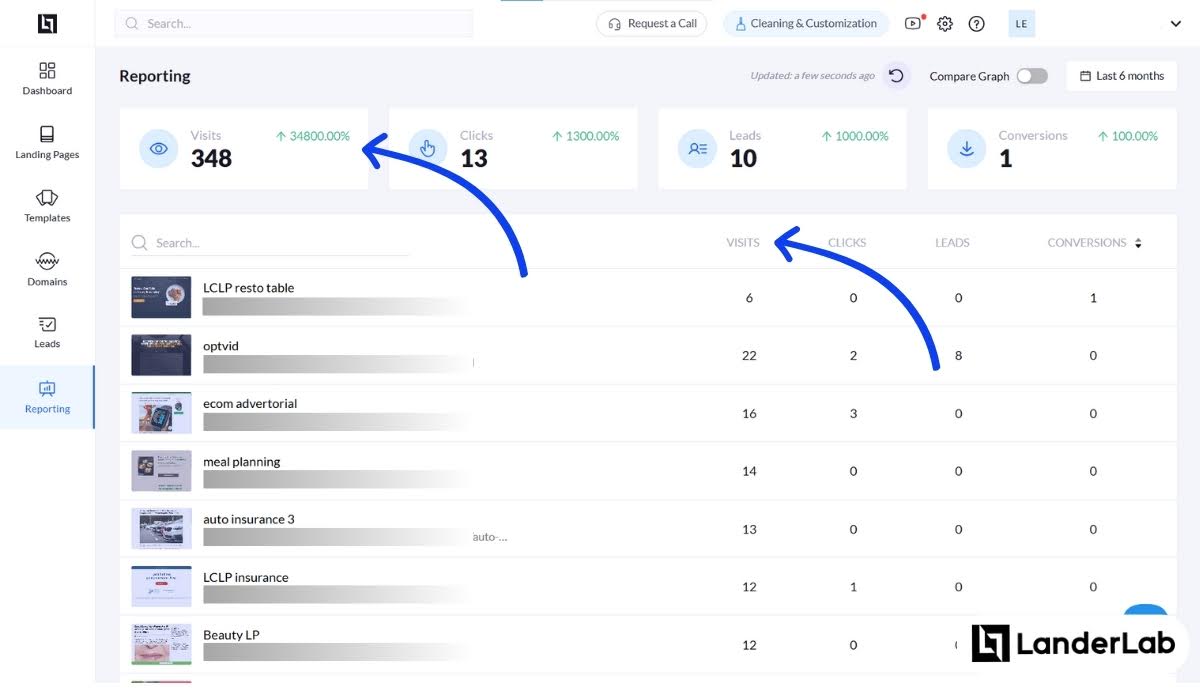
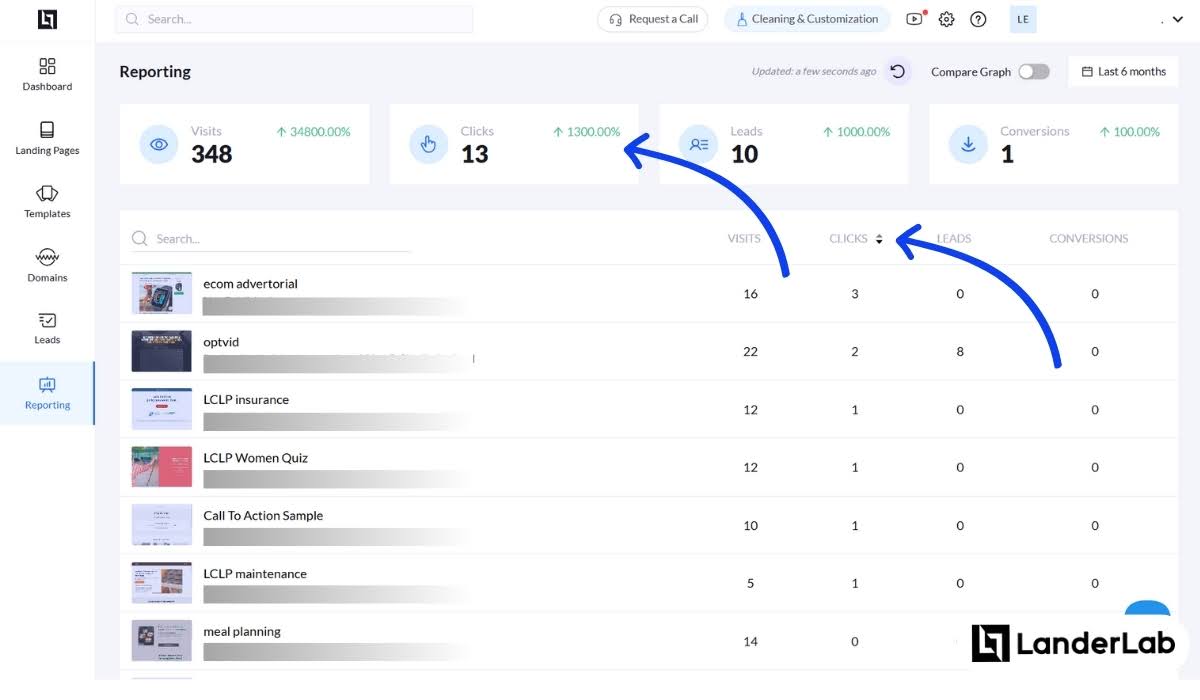
This is the total count of individual user interactions on a page. Integrating with GA4 or other tracking systems, this can be further segmented according to name, source (newsletter, ads, and social media), and medium (banner, cpc, email). Creating tracking links using these UTM parameters for all clickable elements can help measure against impressions or views.
Landerlab’s Analytics directly show clicks to your landing pages, as shown below:
While clicks are the raw absolute number, the click-through rate is the percentage of visitors who click on your content. The equation for solving this is:
Tracking CTR allows for comparative analysis across different campaigns and more standardized performance comparisons across various lead generation channels.
The exit rate shows where users typically leave after exploring multiple pages. It tracks the percentage of page views that were the last in a user’s session and commonly applies to pages that may be part of a multi-page browsing experience.
Calculated as:
Comparing this metric against Clicks will help identify the demographics and touchpoint where users are most likely to leave the conversion funnel.
Lead Acquisition Metrics
These metrics focus on tracking the volume and progression of potential leads through your marketing and sales funnel. Visualize your customer’s journey. How much of your audience moves from one key touchpoint to another? Lead acquisition metrics will help you understand the pace and scale of your lead generation efforts.
In our previous article about lead capture pages, we specified two ways to segment leads: one based on how close they are to purchasing and the other based on whether they have met specific engagement criteria. In terms of KPIs, we’ll use the latter one.
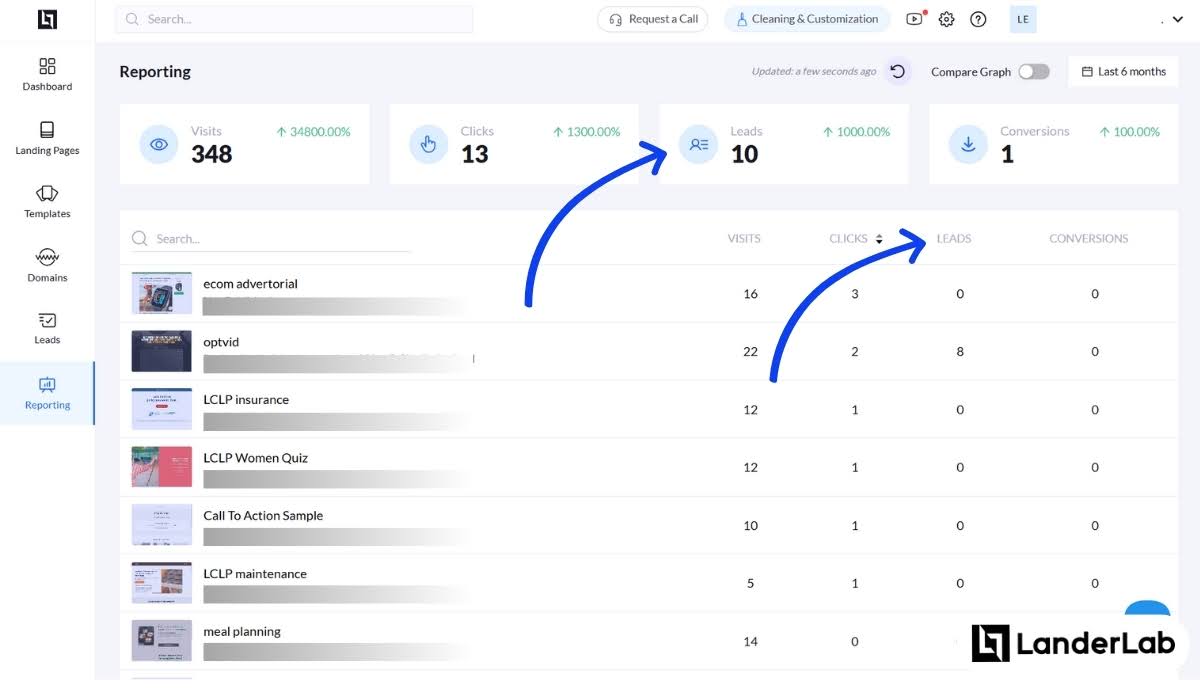
What counts as leads to your campaign? Signing up for the newsletter? Responding to a chat? Basically, when you get a prospect’s contact information, an email or phone number, they count as a lead. The total number of leads is an important KPI that helps you understand how many are interested in your marketing campaigns.
But as we say, not all leads are made equal, so other metrics need to filter this out according to their intent to purchase and your set criteria.
IQLs are at the earliest stage of lead qualification. They may have just learned about your business but have already signed up for freebies. They have the lowest level of engagement and purchase intent.
MQLs filter leads that have shown substantial interest in your marketing efforts. They may have demonstrated engagement beyond initial information exchange, such as leaving comments in blog articles or participating in live webinars.
Define clear criteria for what constitutes an MQL in your business, configure lead scoring rules in your marketing automation platform, and establish processes for tracking how leads move from general prospects to MQL status.
SQLs are vetted leads deemed ready for direct sales engagement. They may have asked for a live demo or reached your checkout pages. This is a key touchpoint in the customer journey, as it is typically passed from marketing to the sales team for direct follow-up.
Work with your marketing and sales team to do the following:
- define SQL criteria,
- set up status fields in your CRM to track when leads reach SQL qualification, and
- create reports that show lead conversion rates from MQL to SQL.
Lead Velocity Rate is the speed at which your lead pipeline is expanding. It is a critical metric that measures the month-over-month growth of qualified leads in your sales pipeline. To compute:
LVR helps predict future revenue potential and evaluate the quality of leads so you can allocate your marketing budget accordingly. Recurring reports are crucial in tracking this KPI.
Lead Quality Metrics
While lead acquisition focuses on quantity, lead quality metrics assess potential and value. What are the key touchpoints where leads interact with content? What’s the chance that those generated leads will convert? These metrics help place priority and focus on the most promising lead opportunities.
Lead value refers to the worth of generated leads. It is calculated based on the lead’s potential revenue and conversion probability. While there are many ways to compute for lead value, the general formula is,
It is primarily a monetary metric representing financial potential. With lead value, you can project the total number of leads needed to achieve a certain sales goal.
While lead value is the monetary equivalent of a lead’s potential, lead quality score is its non-monetary equivalent. It measures the likelihood of a lead converting into a customer based on criteria. In short, it helps you identify high quality leads.
You can systematically rank leads based on their perceived value and likelihood of becoming customers. This is called lead scoring. You will score a lead according to the numerical value of their demographic information, behavioral data, and engagement levels.
With the resulting lead quality score, you can identify your campaign’s best-performing marketing channels. This is lead source attribution—tracking which lead generation channels generated specific leads.
To get this metric, configure lead capture forms to record source information, set up first-touch and last-touch attribution models in your analytics platform, and integrate these insights with your CRM. Combining this with lead value, you can create automated reports showing average lead value by source.
Conversion Metrics
Conversion metrics measure the effectiveness of turning leads into actual customers. These metrics provide critical insights into the efficiency of your marketing and sales process.
Conversions can be interpreted and used in many ways. You can set a conversion when a visit happens, when a form is completed (became a lead), when a purchase is made, when a click is made on the CTA of your lead generation landing page, and so on.
When using conversions as your KPI, make sure you establish what a “conversion” really means for you to avoid confusion.
For instance, in LanderLab, you can set either Visit, Form Submit, or Link Click as Conversion.
![]()
Conversion rate is the percentage of leads that convert to customers with the formula:
Time to conversion is the average time it takes a lead to go from first contact to becoming a customer. This is an important Key Performance Indicator for time-bound sales campaigns because it measures how well your sales funnel works and how quickly possible customers move through the buying process. It also helps find bottleneck and improve the sales cycle for faster conversions.
This metric tracks the number of sales meetings scheduled and completed with potential leads. It provides insights into sales team engagement, lead interest, and the effectiveness of initial outreach strategies.
Cost Metrics
Cost metrics are mostly monetary metrics that analyze the financial investment required to generate and acquire leads and customers. These metrics help optimize marketing spending and allocate budget according to effective lead generation strategies.
Cost Per Lead refers to the amount spent on marketing to generate each new lead. It is calculated with the formula:
The lead cost helps businesses understand the financial efficiency of their lead generation efforts across different marketing channels.
Cost per Conversion is the amount spent to obtain a specific action. Conversion may refer to sale, sign-up, or subscription. The formula for it is:
Remember that conversion may vary according to a business’s nature. Nonetheless, it helps evaluate the financial effectiveness of marketing campaigns in driving conversion goals. To monitor this, set up conversion tracking across all digital platforms (Google Ads, social media), integrate with your analytics system, and create dashboards showing cost efficiency for each campaign conversion action.
Customer Acquisition Cost is the total amount spent to acquire a new customer, including marketing and sales costs. It is calculated with the formula
CAC provides a comprehensive view of the investment needed to bring new customers into your business.
Revenue Metrics
Revenue refers to KPIs that track the financial outcomes of your lead generation efforts. You may be asking why this is still important in lead generation. These metrics provide a direct link between marketing and sales efforts to business revenue.
Average deal size refers to the revenue received from sales. To calculate,
It measures the typical monetary value of individual sales transactions. This helps analyze the financial impact of each successful conversion and is relevant to understanding your customer’s lifetime value.
You can monitor deal values across specific periods and create trend reports to track changes in deal size over time. This metric can assess whether customers will increase their spending throughout marketing campaigns.
Average revenue generated per customer provides insight into the average financial contribution of each customer. It is calculated using the formula:
ARPC provides an outlook into customer value and pricing strategies. With it, you can optimize the content of your lead capture landing pages according to what your customers respond to, boosting your CTR or lead conversion rates.
Purchase frequency is a metric that measures how often a customer makes a purchase within a specific period. It calculates the average number of times a customer buys from your business over a defined timeframe, such as a month, quarter, or year.
In formula,
A higher purchase frequency suggests stronger customer relationships and more effective lead nurturing strategies, while a lower frequency might indicate a need to improve customer retention or product offerings.
Customer Lifetime Value is the total revenue from a customer relationship.
How long has a customer been doing business with you? What’s their average purchase value throughout this time? How often do they purchase? Answering these questions will lead to a customer’s lifetime value.
In formula,
CLV predicts the total revenue a business can expect from a single customer throughout their entire relationship. It combines purchase frequency, average deal size, and customer relationship duration.
Set up cohort analysis in your analytics platform and develop predictive models that estimate future value based on historical customer behavior. Some tools automate these to aid in assessing long-term customer profitability and marketing investment.
MRR is your business’s predictable monthly revenue. This KPI is best used to track sales from subscription-based services or recurring revenue models. It calculates the normalized revenue generated monthly from ongoing customer payments, which is critical in budgeting expenses.
Churn is when customers leave the business. The churn rate is the percentage of customers who stop doing business with a company within a specific period. To calculate churn rate,
It indicates customer retention challenges and potential issues with product or service satisfaction. It is still important in lead generation metrics because it can help analyze the qualities of leads that quickly churn.
It may seem daunting to track the right lead generation metrics, but you only really need to track what is crucial to your business. So, how do you know which are important to track in a sea of data? Let’s find out!
How to Identify The Right Lead Generation Metrics to Track?
As we’ve said, what’s important to your brand will be the most important metric to track. What’s the state of your website traffic in the last 6 months? Are you looking to decrease acquisition costs? Who is your target audience?
These are just some questions you must answer when setting up your KPIs, and it may seem like too much, but it’s relatively simple. Here’s a 3-step process you can follow to identify what lead generation metrics to track:
1. Align Business Objectives
Businesses can determine which lead generation metrics to track by first defining their specific marketing and sales objectives. Remember, your goals must be SMART (Specific, Measurable, Achievable, Relevant, Time-bound).
When defining your goals, focus on key outcomes. Goals must also highlight what your campaigns need to test and improve. Metrics should then align with the key business goals established.
2. Select Metrics Criteria
Companies should prioritize actionable metrics that can drive strategic decision-making. This means considering the entire customer journey and selecting metrics that provide actionable insights at different marketing and sales funnel stages.
Your criteria in selecting metrics must be aligned with your business goals.
While most metrics are numerical and pertain to quantitative data, qualitative data are also used to qualify leads into segments. Because it’s non-numerical, great marketers use scoring systems to measure these qualities.
For example, questions tend to be perception-based when collecting customer feedback. Answers to questions like “How do you feel about our product?” or “What did you not like about the service?” are assigned scores to compare data between segments. Tools like SEQ or NPS are used for this.
3. Set Up Evaluation
You have the goals and now the criteria you want for the KPIs, but you still need to know if these metrics are effective. Knowing how to evaluate the results of your metrics allows businesses to be adaptable.
New market trends may emerge or a possible core update to Google’s algorithms can affect how you measure lead generation success. Setting up monthly performance reviews or refining target audience segmentation can be part of this evaluation.
After identifying the right lead generation KPIs are important for your business, now you need to understand the best KPI to use in a campaign.
What’s the Best KPI to Use for a Campaign?
Now that we’ve explored the landscape of lead generation metrics, the next critical step is selecting the most impactful KPIs for your specific marketing campaigns. Understanding which metrics matter requires a strategic approach that aligns with your unique business goals, target audience, and marketing objectives.
Strategic KPI Selection Framework
1. Align KPIs with Campaign Objectives
Different campaigns require different measurement approaches:
- Awareness Campaigns: Focus on reach metrics like website traffic volume, impressions, and session duration. These metrics help evaluate how effectively you’re expanding your brand’s visibility.
- Lead Capture Campaigns: Prioritize lead count, cost per lead (CPL), and lead-to-MQL conversion rates. These metrics indicate how efficiently you’re generating potential customers.
- Conversion Campaigns: Emphasize conversion rates, customer acquisition cost (CAC), and revenue metrics like average deal size. These metrics reveal your success in turning leads into paying customers.
2. Consider Campaign Stage and Funnel Position
- Top-of-funnel (Awareness): Website metrics, engagement rates, and social media metrics capture initial interest.
- Middle-of-funnel (Consideration): Lead quality scores, MQL-to-SQL conversion rates, and time to conversion track progression through your pipeline.
- Bottom-of-funnel (Decision): Cost per conversion, SQL-to-customer conversion rates, and average revenue per customer measure final conversion effectiveness.
3. Implement Multi-Dimensional Analysis
Rather than relying on isolated metrics, create complementary KPI pairings that provide context:
- Volume + Quality: Pair lead quantity metrics with lead scoring to ensure you’re not just generating more leads, but better ones.
- Cost + Value: Combine cost metrics (like CPL) with value metrics (like lead value or CLV) to assess true ROI.
- Short-term + Long-term: Balance immediate metrics (like conversion rates) with predictive metrics (like Lead Velocity Rate) to maintain both tactical and strategic perspectives.
4. Prioritize Actionable Insights
The best KPIs provide clear direction for optimization:
- Diagnostic Metrics: Identify metrics that can pinpoint specific problems, such as exit rates on key pages or conversion drop-offs at specific funnel stages.
- Comparative Benchmarks: Select metrics that can be meaningfully compared against industry standards, historical performance, or cross-channel results.
- Leading Indicators: Focus on metrics that can predict future performance, like engagement quality and lead response times.
Practical KPI Selection Matrix
| Campaign Type | Primary KPIs | Secondary KPIs | Warning Indicators |
|---|---|---|---|
| Brand Awareness | Traffic Volume, Impressions, Average Session Duration | New Visitor %, Social Engagement | Bounce Rate, Low CTR |
| Lead Generation | Lead Conversion Rate, Cost Per Lead, Lead Quality Score | MQL Rate, Form Completion Rate | High CPL, Low Quality Score |
| Nurturing | Email Open/Click Rates, Content Engagement, Time in Funnel | Lead Progression Rate, Webinar Attendance | Stalled Leads, Email Unsubscribes |
| Conversion | Conversion Rate, Customer Acquisition Cost, Time to Conversion | Average Deal Size, Sales Cycle Length | High CAC, Low Close Rate |
| Retention | Churn Rate, Customer Lifetime Value, Purchase Frequency | Repeat Purchase Rate, Upsell/Cross-sell Rates | Increasing Churn, Decreasing ARPC |
Remember that the “best” KPI depends on your business type, campaign goals, and how your audience acts. Start with a set of useful metrics, measure regularly, and improve your approach based on what gives your sales and marketing team the most helpful insights.
Manual Tracking or Automated Tracking? How to Better Monitor Your Lead Generation Metrics
How you track your lead generation metrics is almost as important as which metrics you track. While spreadsheets and manual reporting might seem cheaper at first, using dedicated tracking tools can greatly improve how you optimize your lead generation campaigns.
Problems with Manual Tracking
Manual tracking usually means:
- Downloading data from several websites
- Typing numbers into spreadsheets
- Making formulas to figure out your metrics
- Creating charts and graphs yourself
- Updating reports regularly
While this gives you control over your data, it has big downsides:
- Takes Too Much Time: Your team spends hours just gathering data instead of using it
- Human Mistakes: People make errors when entering data, which leads to wrong decisions
- Outdated Information: By the time you finish your report, the data is already old
- Hard to Connect: Bringing together data from different sources gets complicated
- Doesn’t Grow Well: As you run more campaigns, manual tracking becomes too hard to manage
Benefits of Using Tracking Tools
Good tracking tools offer major benefits for your lead generation efforts:
1. See Results Right Away
Tracking tools show you data almost instantly, so you can:
- Watch how campaigns are doing in real-time
- Spot and fix problems quickly
- Take advantage of opportunities as they happen
- Try new ideas and see results fast
2. More Accurate Data
Automated systems make fewer mistakes by:
- Removing the need to enter data by hand
- Using the same methods to calculate metrics every time
- Keeping data clean across different platforms
- Making it possible to check where data came from
3. Connects Everything Together
Good tracking tools bring all your marketing data into one place:
- Combine data from all your marketing channels
- See the full customer journey in one view
- Understand which channels deserve credit for leads
- Connect marketing and sales data
4. Smarter Data Analysis
Good tracking tools can do more than basic reporting:
- Find patterns you might miss
- Predict future trends
- Automatically spot unusual changes
- Show which marketing efforts led to sales
- Compare different groups of customers
5. Easier Reporting and Teamwork
Automated tracking helps your whole team work better:
- Send reports automatically on a schedule
- Create custom views for different team members
- Share insights with comments and notes
- Access reports from any device
6. Grows With Your Business
As your campaigns get bigger, tracking tools can:
- Handle more data without slowing down
- Work with new marketing channels as you add them
- Support more complex marketing efforts
- Keep old data while adding new measurements
Is It Worth the Cost?
While tracking tools require an upfront investment, they typically pay for themselves in multiple ways over time.
Your team will spend significantly less time collecting and organizing data, allowing them to focus on analyzing insights and making improvements.
The reduction in human errors leads to more reliable data and better decision-making across your marketing efforts. With real-time insights at your fingertips, you can adjust campaigns much faster, capitalizing on opportunities and fixing problems before they impact your results.
Better attribution data helps you allocate your marketing budget more effectively, directing resources to the channels and tactics that actually drive results. And in competitive markets, having solid, up-to-date data gives you the ability to react more quickly than competitors who are still manually crunching numbers.
While tracking tools do cost extra money, in the long run, they save you money by making your marketing more effective, eliminating the need to juggle countless spreadsheets, reducing human errors, and automatically generating reports based on your needs.
Keeping a Balanced Approach to KPI Tracking
Good lead generation needs more than just collecting data. It needs a smart way to track KPIs (Key Performance Indicators). Metrics give useful insights, but what really matters is how you use them. A good approach means not using just one metric too much. Instead, try to see your marketing results as a whole picture.
As your business grows, how you measure should change too. Often check and update your KPIs. Be ready to change when markets change, when new tools come out, and when customers start acting differently. This way, your metrics stay useful and give you good insights.
The goal is to build lead generation that uses data and always tries to get better. With these metrics, you can make your efforts better to get high-quality leads.
Help sales and marketing teams work together. Be curious about data, and see metrics as tools to make good choices, not just as strict rules. By keeping this balanced, changing approach, businesses can use data to make plans that help them grow for a long time.


![21 Best Lead Generation Tools & Software [2026 Comparison]](https://wp.landerlab.io/wp-content/uploads/2025/10/15-Best-Lead-Generation-Tools-Software-for-2040.webp "21 Best Lead Generation Tools & Software [2026 Comparison]")