You’re running paid traffic. Your ads are live, your targeting is dialed in, and leads are coming in. But how do you know if you’re paying too much for them?
That depends entirely on your industry. A $90 lead is a win for a legal services firm and a disaster for an e-commerce brand. A $200 lead in insurance barely raises an eyebrow. The same number in home services would send most campaign managers back to the drawing board.
This guide breaks down average cost per lead (CPL) by industry for 2026, across the channels media buyers and lead gen teams actually use: Google Ads, Meta, and blended paid/organic.
You’ll also get a framework for figuring out what your CPL should be based on your numbers, not someone else’s benchmark.
What Is Cost Per Lead (CPL) and How Do You Calculate It?
CPL measures how much you spend to acquire a single lead. The formula is:
CPL = Total Ad Spend / Total Leads Generated
Simple enough. But CPL alone tells you almost nothing. A $50 CPL converting at 30% beats a $15 CPL converting at 5% every time.
The number only means something when you tie it to your close rate and customer lifetime value (LTV).
More on that below. First, the benchmarks.
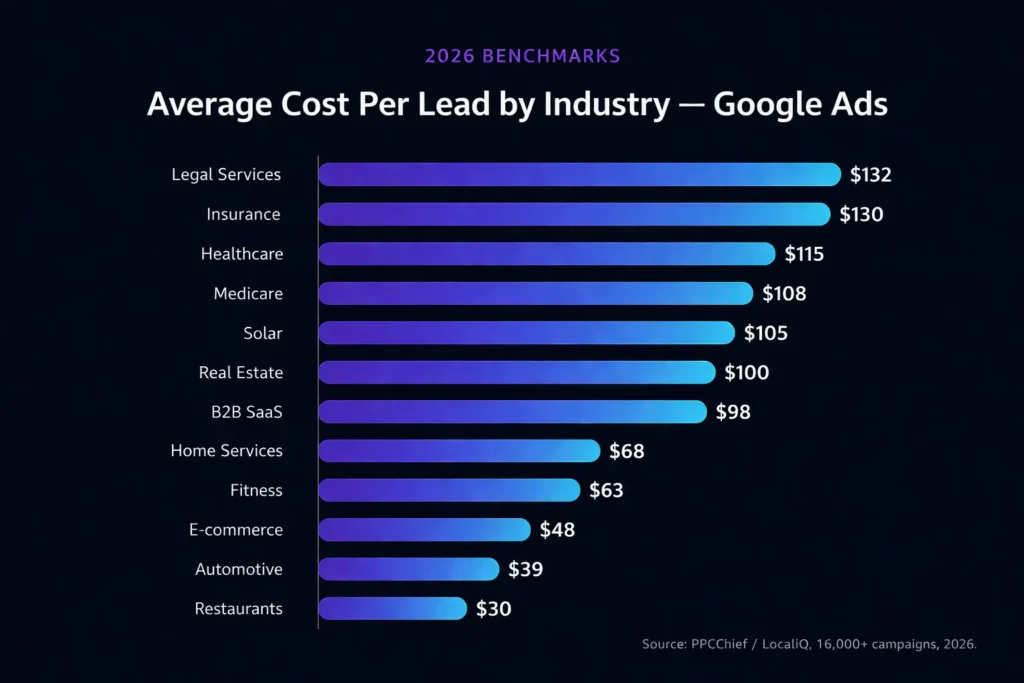
Average Cost Per Lead by Industry: 2026 Benchmarks
The table below covers blended CPL averages across paid and organic channels. These are directional benchmarks based on aggregated data from multiple industry sources.
Your actual CPL will vary based on traffic quality, offer, landing page, and how you define a lead.
| Industry | Avg. CPL (Blended) | Google Ads CPL | Meta Ads CPL |
|---|---|---|---|
| Legal Services | $650+ | $132 | $72 |
| Insurance / Finance | $160–$260 | $100–$160 | $58–$190 |
| Higher Education | $980 | $90 | N/A |
| B2B SaaS / Technology | $237 | $75–$120 | $63 |
| Healthcare | $163 | $85–$145 | $42–$52 |
| Real Estate | $120–$200 | $100 | $52–$57 |
| Home Services | $90–$150 | $25–$110 | $34 |
| Solar | $80–$150 | $80–$130 | $60–$90 |
| Mortgage / Debt | $100–$200 | $90–$140 | $60–$100 |
| Medicare / Senior Care | $75–$160 | $85–$130 | $55–$85 |
| E-commerce | $91 | $48 | $27 |
| Fitness / Wellness | $65–$90 | $63 | $30 |
| Automotive | $35–$65 | $28–$50 | $25–$45 |
| Restaurants / Local | $20–$40 | $30 | $15–$25 |
| Nonprofit | $25–$45 | N/A | $20–$35 |
A few things worth noting:
- Legal services and insurance consistently have the highest costs across all advertising channels. The reason is simple: high lifetime value per customer means advertisers can afford to bid more.
- Meta CPLs are almost always lower than Google’s, but Google leads tend to convert at higher rates because they come from active search intent rather than passive scrolling.
- Home services show the widest variance. A roofing lead in a major metro can exceed $200, while a landscaping lead in a rural market might run $30-$45.
- Higher education tops the blended charts because of long, complex decision cycles and the high lifetime value of an enrolled student.
Cost Per Lead by Traffic Source: What the Channel Breakdown Actually Looks Like
Industry is only half the picture. Where your traffic comes from shapes your CPL just as much as what you’re selling.
Google Ads
The average Google Ads CPL across all industries in 2026 sits at $70.11, up roughly 5% from 2024. You’re capturing people who are actively searching for a solution, which is why Google leads typically close at 2–3x the rate of social leads. That premium is usually worth paying.
Industries seeing the steepest increases in CPL on Google: legal, insurance, and SaaS. Increased competition and AI Overviews reducing organic click share are pushing more advertisers into paid, driving bids up.
Meta / Facebook Ads
Meta CPLs are lower across the board, but the leads are colder. You’re interrupting someone’s scroll, not answering their search. The quality gap is real: a $40 Meta lead in home services might close at 8%, while a $90 Google lead closes at 20%.
Do the math before optimizing purely for CPL.
That said, Meta has improved significantly in 2025–2026. Advertisers using the Conversions API with clean first-party data are reporting CPLs 15–25% lower than those of pixel-only campaigns. If you’re running Meta and haven’t set up CAPI, that’s the first thing to fix.
Organic / SEO
Organic leads cost 20–40% less than paid across almost every industry, and they convert at higher rates because the intent is self-qualified. The catch is time: organic takes 6–12+ months to produce meaningful volume. The best-performing lead gen operations run paid for speed and organic for long-term cost reduction.
Multi-Channel
Multi-channel prospecting (coordinating paid search, paid social, and email) averages around $188 CPL blended and often produces the best qualified leads because prospects see you across multiple touchpoints before converting. The drop in CPL compared to running channels in isolation comes from audience reinforcement: someone who sees your ad on Meta and then searches for you on Google is warmer than a cold click from either channel alone.
What’s a Good CPL? How to Set Your Own Target
Here’s the thing most benchmark articles skip: a “good” CPL depends entirely on your numbers, not an industry average.
Use this formula to calculate your acceptable CPL:
Target CPL = LTV × Gross Margin % × Close Rate
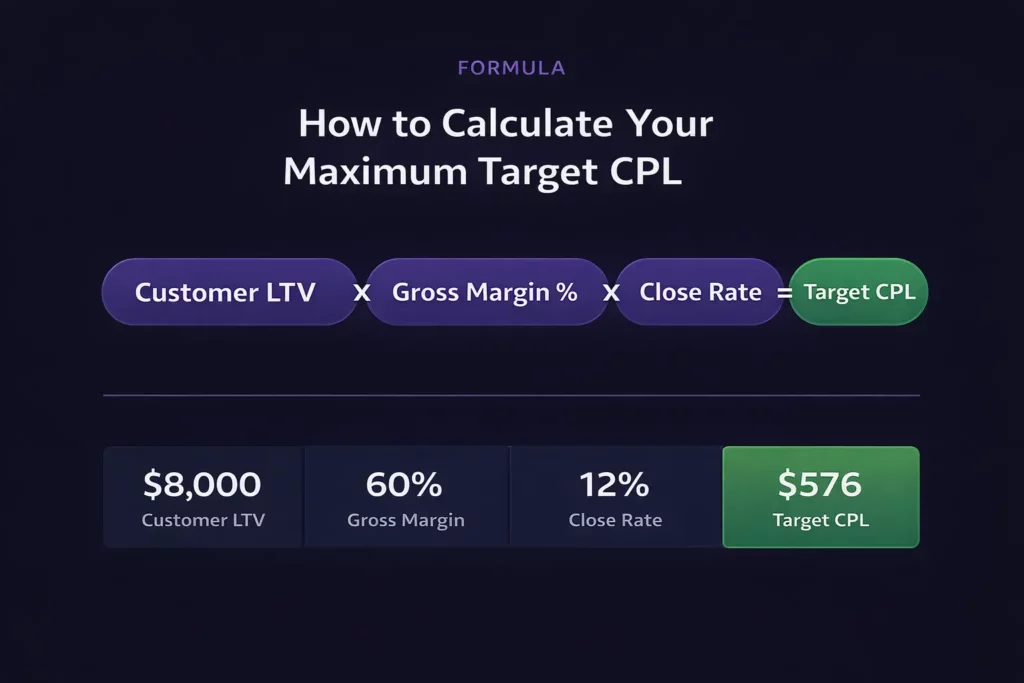
Example: Your average customer is worth $8,000 in lifetime revenue. Your gross margin is 60%. Your sales team closes 12% of marketing-qualified leads.
Target CPL = $8,000 × 0.60 × 0.12 = $576
That means you can afford to pay up to $576 per lead and still have a healthy business. If your current CPL is $90, you have significant room to scale spend. If it’s $700, you have a problem.
The industry benchmark tells you whether your CPL is typical. Your LTV math tells you whether it’s sustainable.
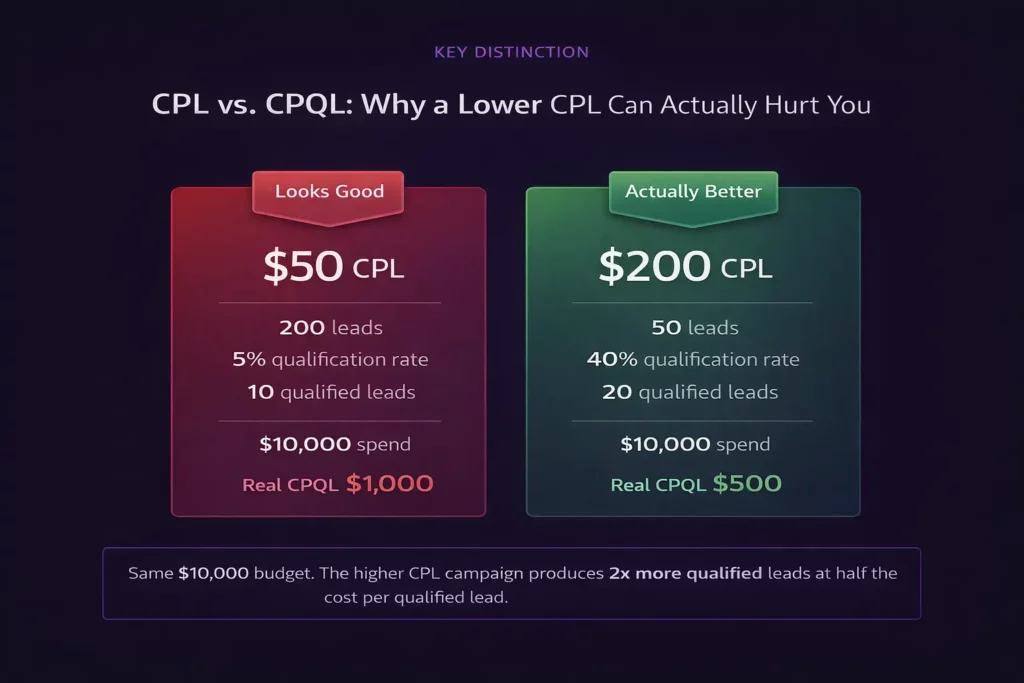
The CPL vs. CPQL Distinction That Most People Miss
Raw CPL counts every lead regardless of quality: the VP who requested a demo and the intern who downloaded something for a class project. Cost per qualified lead (CPQL) is the metric that actually predicts pipeline performance.
A $50 CPL with a 5% qualification rate gives you a CPQL of $1,000.
A $200 CPL with a 40% qualification rate gives you a CPQL of $500. Optimizing for CPL without tracking qualification rates is how you hit your lead target and miss your revenue target.
What’s Driving CPL Up in 2026
If your CPL has climbed over the past 12 months, you’re not imagining it. A few forces are pushing costs up across the board:
Paid channel inflation. Google Ads CPL rose 5% from 2024 to 2025. Meta CPLs are up 5–10% across the industry.
More advertisers competing for the same audiences on platforms with tighter targeting data means higher bids for less precise reach.
Privacy restrictions. iOS updates and cookie deprecation have reduced targeting accuracy on paid social. Retargeting campaigns and lookalike audiences are less efficient than they were two years ago. Advertisers relying on platform-native targeting are paying more for lower-quality audiences.
AI Overview impact. Google’s AI Overviews are absorbing clicks on informational queries, pushing advertisers further toward commercial keywords where competition and CPCs are higher.
Quality inflation. A $200 lead in 2026 is a more qualified prospect than a $100 lead was in 2023, because what counts as a lead has changed. More companies are gating at the qualified stage rather than the initial form fill. Higher CPL often reflects better lead quality, not just rising costs.
5 Ways to Lower Your CPL Without Sacrificing Lead Quality
1. Fix Your Landing Page Before You Touch Your Ads
Most media buyers A/B test ad creative obsessively while routing all traffic to the same landing page. Your landing page conversion rate has a larger impact on CPL than any ad variable. A page that converts at 8% instead of 4% cuts your CPL in half with zero change to your ad spend.
The highest-impact things to test: headline, social proof placement, form length, and page load speed. Test one variable at a time with enough traffic to reach statistical significance before calling a winner.
If you’re running traffic to a generic homepage instead of a dedicated landing page built for that specific campaign, fix that first. Dedicated landing pages outperform homepages on CPL by 40–70% in most paid traffic contexts.
2. Set Up First-Party Data Infrastructure
On Meta, switch from pixel-only tracking to Conversions API. On Google, enable Enhanced Conversions and import offline conversion data so the algorithm optimizes for leads that actually close, not just form fills.
Advertisers who implement this typically see CPL drop 15–25% within 60 days as the platforms learn which lead types convert downstream.
3. Tighten Your Keyword Targeting on Google
Move core keywords from broad match to phrase and exact match. Review your search terms report weekly and aggressively add negatives. Irrelevant clicks inflate CPL without producing leads. Each ad group should route to a page designed specifically for that search intent.
4. Use Multi-Step Funnels for High-CPL Industries
In insurance, solar, Medicare, and other high-CPL verticals, a quiz or multi-step funnel qualifies leads before they reach a form, filtering out low-intent traffic and improving lead quality.
Better leads mean higher close rates, which means your CPL can be higher in absolute terms while still being profitable. The goal is to lower the cost per customer, not the cost per lead.
5. Build Organic Alongside Paid
Paid channels deliver leads today. Organic builds an asset that compounds over time. Businesses running both in parallel typically see their blended CPL drop by 30–60% over 12–18 months as organic volume grows and dependence on paid decreases.
The industries where organic CPL is closest to paid CPL (like cybersecurity) are the ones where content is too technically expensive to produce. For most industries, there is a significant gap and a real opportunity.
CPL by Vertical: Notes for the Industries LanderLab Users Run Campaigns In
Insurance and Medicare
Among the most expensive verticals in paid traffic. Google Ads CPL for insurance runs $100–$160. Medicare specifically costs $85–$130 on Google, $55–$85 on Meta. Multi-step quiz funnels are the standard approach here because they qualify intent before collecting contact information, which keeps lead quality high even as CPL climbs.
Solar
Solar CPL has risen significantly as the market has matured and competition for homeowner leads has intensified. Expect $80–$150 blended, with Google skewing higher and Meta lower. Geo-targeting matters enormously: high-solar-penetration markets like California and Texas have 30–50% higher CPLs than emerging markets.
Home Services (Roofing, HVAC, Plumbing, Remodeling)
The most volatile category. Roofing CPL in major metros can exceed $200 for exclusive leads. HVAC and plumbing are significantly lower. The channel split matters:
Google captures high-intent search (“emergency AC repair near me”), and Meta works better for awareness-stage campaigns in home improvement. Expect $25–$110 on Google and $30–$60 on Meta, depending on service type and market.
Debt Consolidation / Finance
Finance CPL on Meta rose 24% between January 2025 and January 2026. Expect $58–$190 depending on product specificity. Compliance requirements add friction to ad creative and landing pages, which tends to push CPL higher.
Landing page quality is especially important here because compliance constraints limit how aggressive you can be with copy.
Real Estate
Google CPL averages $100, Meta runs $52-$57, and is projected to rise through 2026. Tier 1 markets (NYC, LA, Miami) see CPLs 30–50% above national averages.
Quiz funnels work well for real estate lead qualification: filtering by buyer vs. renter, budget range, and timeline before collecting contact info dramatically improves lead quality and close rates.
Frequently Asked Questions: Cost Per Lead
What is a good cost per lead?
A good CPL depends on your industry, traffic source, and unit economics. The cross-industry average sits around $198 in 2026, but that number means very little on its own. The right way to calculate your target CPL is: LTV × Gross Margin % × Close Rate. If the result exceeds what you’re currently paying per lead, your CPL is sustainable. If it’s lower, you have a profitability problem regardless of how the number compares to industry benchmarks.
What is the average cost per lead on Google Ads?
The average Google Ads CPL across all industries in 2026 is $70.11, up roughly 5% from 2024. That average hides a wide range: legal services averages $132, real estate $100, e-commerce $48, and restaurants as low as $30. Google leads tend to close at higher rates than social leads because they come from active search intent, which often justifies the higher CPL compared to Meta.
What is the average cost per lead on Facebook?
Meta Ads CPLs vary widely by industry in 2026. E-commerce averages $27, home services $34, healthcare $42–$52, real estate $52–$57, B2B SaaS $63, legal services $72, and finance $58–$190 depending on product type. Meta CPLs are generally lower than Google Ads, but the leads are colder since you’re reaching people who weren’t actively searching for your product. Advertisers using Conversions API with first-party data typically see CPLs 15–25% lower than those relying on pixel-only tracking.
What is the difference between CPL and CPA?
CPL (cost per lead) measures the cost to acquire a potential customer who has expressed interest, typically by filling out a form or requesting information. CPA (cost per acquisition) measures the cost to acquire a customer who has completed a purchase or signed a contract. CPA is always higher than CPL because it accounts for the leads that don’t convert. If your CPL is $50 and 20% of leads become customers, your CPA is $250.
How do I reduce my cost per lead without losing quality?
The highest-impact changes are: improving your landing page conversion rate (a page converting at 8% instead of 4% halves your CPL with no change to ad spend), setting up first-party data tracking via Conversions API on Meta and Enhanced Conversions on Google, tightening keyword targeting from broad to phrase and exact match, and using multi-step quiz funnels to qualify leads before they reach a form. Building organic traffic alongside paid over 12–18 months also reduces your blended CPL significantly over time.
Why is my cost per lead increasing?
CPL is rising across most industries in 2026 due to a few compounding factors: paid channel inflation (Google Ads CPL rose 5% year-over-year, Meta CPLs are up 5–10% industry-wide), reduced targeting accuracy from iOS privacy changes and cookie deprecation, and more advertisers competing for fewer viable keywords as Google AI Overviews absorb organic clicks. If your CPL is rising faster than your industry benchmark, the most likely culprits are underperforming landing pages, broad keyword targeting, or deteriorating ad creative quality.
Which industry has the highest cost per lead?
Higher education has the highest blended CPL at around $980, driven by long decision cycles and the high lifetime value of an enrolled student. Legal services follow closely, with blended CPLs exceeding $650 when measured at the qualified lead stage. On a paid-only basis, legal services consistently top the charts on both Google Ads ($132 average) and Meta ($72 average) due to intense competition for a limited pool of high-value clients.
Which industry has the lowest cost per lead?
Restaurants, local services, and nonprofits consistently have the lowest CPLs, typically ranging from $15–$45 depending on channel. E-commerce also sits on the lower end at around $27 on Meta and $48 on Google. These industries benefit from high search volume, broad audience targeting, and relatively straightforward conversion actions that don’t require extensive lead nurturing before a sale.
The Bottom Line
CPL benchmarks are a starting point, not a finish line. Use industry averages to understand whether your costs are typical, then use your own LTV and close-rate math to determine whether they’re acceptable.
If your CPL is above the benchmark but your close rate and LTV support it, you probably don’t have a problem. If your CPL is below the benchmark but your leads aren’t converting, you have a quality problem that a lower CPL will make worse.
The fastest lever most advertisers have is landing page performance. Ad creative, targeting, and bid strategy all matter, but if your page converts at 3% when it should convert at 8%, you’re effectively paying 2.5x more per lead than you need to. That’s the gap worth closing first.
Sources
- First Page Sage: Average Cost Per Lead by Industry 2026
- AdAmigo: Meta Ads Cost Per Lead Benchmarks by Industry 2026
- PPCChief: Google Ads Cost Per Lead 2026
- Martal: Cost Per Lead by Industry 2026 Benchmarks and Insights
- Emulent: Average Cost Per Lead by Industry 2026
- Aged Lead Store: Home Improvement Lead Costs by State and Service Type


