Sending paid traffic to a homepage is like running a TV ad that tells people to Google your competitor. You paid for the attention. You just gave it away somewhere else.
77% of Google Ads campaigns send traffic to pages that weren’t built for the ad that sent them there.
Homepages, product category pages, and generic contact forms. Pages with navigation menus, competing CTAs, and no message that matches the ad that brought the visitor in. The click costs you money. The page cost you the conversion.
This guide covers what a Google Ads landing page needs to convert paid traffic, broken down by campaign type and vertical, with real before-and-after examples.
It includes a conversion-rate benchmark table by industry, a message-match audit framework, a Quality Score calculator, and a landing-page diagnostic tool you can use on your current pages right now.
Why Google Ads Landing Pages Are Different
A Google Ads visitor arrived with a specific intent. They typed a query, saw your ad, and clicked because the ad promised something specific.
Your landing page has roughly three seconds to confirm that promise before they bounce back to the search results and click on your competitor.
Google also evaluates your landing page directly through Quality Score. Quality Score affects your ad rank and your cost per click.
A low-quality landing page means you pay more per click and rank lower than competitors with better pages, even if your bid is higher.
The three components of Quality Score are expected click-through rate, ad relevance, and landing page experience. You control the last one entirely.
A high landing page experience score requires: fast load time, content that matches what the ad promised, a clear and relevant CTA, and a good mobile experience.
Get those right, and your CPC drops. Get them wrong, and you’re subsidizing your competitors.
Google Ads Landing Page Conversion Rate Benchmarks by Vertical
Before optimizing anything, you need to know what you’re optimizing toward. These are 2026 conversion rate benchmarks for Google Ads landing pages by vertical, based on aggregated data from WordStream, Unbounce, and industry-specific reports.
| Vertical | Avg. CVR | Top 25% | What “Good” Looks Like |
|---|---|---|---|
| Legal Services | 4.2% | 7%+ | Specific practice area, local trust signals, and click-to-call are prominent |
| Home Services | 3.8% | 8%+ | Local photos, fast response promise, clear service area |
| Insurance | 3.3% | 6%+ | Quiz funnel for qualification, compliance language, trust badges |
| B2B SaaS | 2.5–4% | 5–8% | Solution-specific pages per ad group, specific social proof numbers |
| Healthcare | 3.6% | 6%+ | HIPAA trust signals, clear next step, doctor credentials visible |
| Real Estate | 2.4% | 5%+ | Local market data, agent photo and credentials, low-friction CTA |
| Solar | 2.8% | 5%+ | Savings calculator, geo-specific messaging, $0 down prominent |
| E-commerce | 2.8% | 5%+ | Product-specific page, reviews, urgency, fast checkout |
| Financial Services | 8.4% | 12%+ | High intent searches, clear eligibility criteria, compliance disclosures |
WordStream 2026 benchmarks, Foundry CRO 2026 data, GrowthSpree B2B SaaS benchmarks, MetricNexus Google Ads benchmarks 2026.
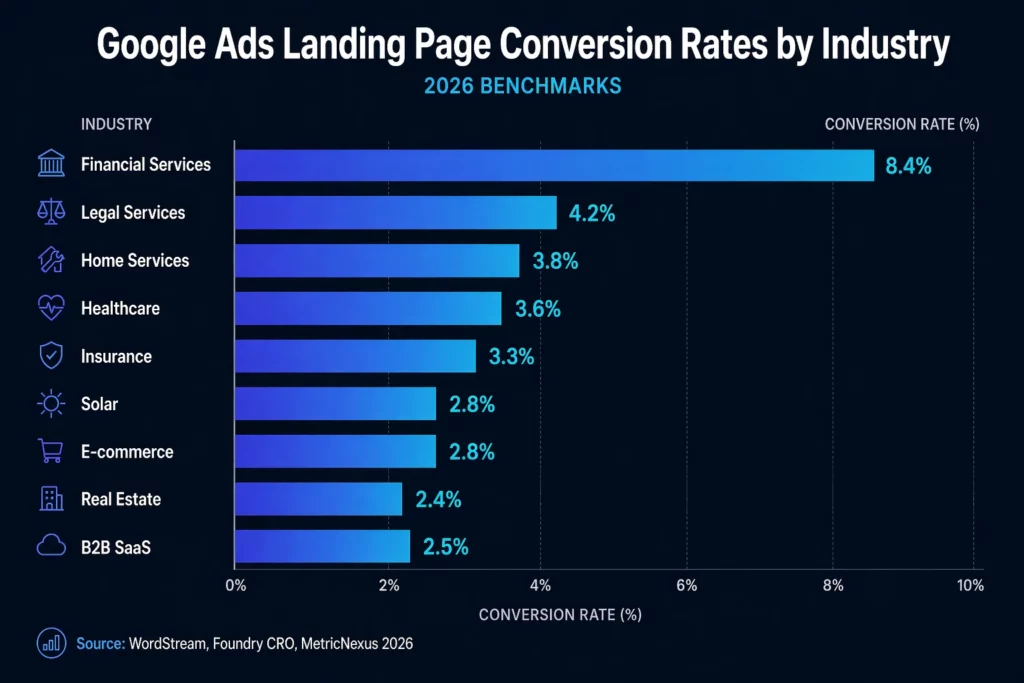
A few things worth noting from this data. Financial services have the highest average CVR because search intent is extremely specific.
Someone searching “debt consolidation loan bad credit” has already decided they need help and is just looking for a provider they trust.
Home services have high top-quartile performance because local pages with genuine social proof dramatically outperform generic ones.
B2B SaaS shows the widest range because page quality varies enormously: the gap between the bottom 25% (under 2%) and top 25% (above 5%) is almost entirely explained by message match and form length.
If your current CVR is below the average for your vertical, the problem is almost always one of three things: a message mismatch between the ad and the page, too many form fields, or insufficient trust signals.
The diagnostic tool later in this article will help you identify which.
The Non-Negotiables: What Every Google Ads Landing Page Must Have
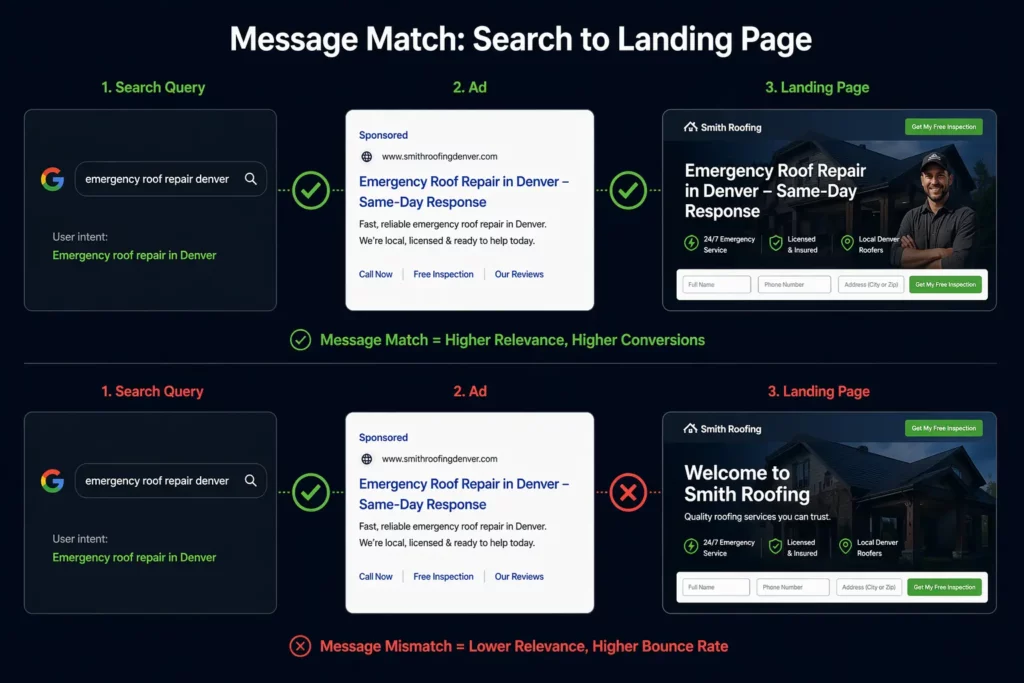
1. Message Match
Message match is the single most impactful variable on a Google Ads landing page.
When someone searches for “emergency plumber New York” and clicks your ad, the first line on your landing page should clearly confirm they’re in the right place.
If your ad says “emergency plumber New York,” your headline should say something like “Emergency Plumbing in New York, Available 24/7,” not “Welcome to Smith Plumbing Services.”
A personal injury law firm was sending Google Ads traffic to their general About Us page.
After building a dedicated landing page with a headline that matched the ad copy exactly, their conversion rate went from 3.1% to 8.4% in six weeks. The offer didn’t change. The targeting didn’t change. Only the page changed.
One B2B SaaS company improved its conversion rate from 1.8% to 4.7% by creating solution-specific landing pages that matched individual ad groups instead of sending all traffic to the same homepage. Same budget, same ads, dramatically different results.
2. A Single Goal
A Google Ads landing page should have exactly one conversion goal. One form, one CTA, one desired action. No navigation menu sends visitors elsewhere. No social media links. No secondary offers are competing for attention.
Navigation links are especially damaging. Every link on a landing page that isn’t the primary CTA is an exit opportunity.
WordStream found that 33% of links on landing pages were sending visitors away from the page entirely, often to social media profiles. Every one of those clicks is a conversion you paid for and didn’t get.
3. Speed
Pages that load in 1 second have 3x higher conversion rates than pages that take 5 seconds. Every additional second costs roughly 7% in conversions. A five-second page is leaving nearly a third of its potential conversions on the table before anyone reads a word of copy.
For Google Ads, page speed affects both Quality Score and actual results. A slow page signals a poor user experience to Google’s algorithm, which can penalize ad rank. The same slow page loses visitors in practice. It’s a double penalty.
Target under two seconds for mobile LCP. Compress all images to WebP. Remove unnecessary scripts. Our internal data show that pages that load meaningful content within 1.5 seconds have 22% lower bounce rates than those that take 3 seconds.
4. Mobile-First Design
The majority of Google Ads traffic arrives on mobile in 2026. If your page is a desktop design that scales down, it’s not mobile-optimized. It’s mobile-tolerated, and that’s not the same thing.
An e-commerce brand noticed 65% of their clicks came from mobile, but 80% of conversions happened on desktop. A mobile checkout redesign closed that gap significantly within one quarter.
The page wasn’t bad. It was just not built for how people were actually using it.
5. Social Proof Above the Fold
Placing trust signals where visitors see them without scrolling reduces the friction between a click and a conversion. The job of social proof is not to create desire. It’s to remove doubt. Place it early and make it specific.
The most effective social proof on a Google Ads landing page is specific and local. “Sarah from Phoenix saved $187 on her first month” outperforms “Thousands of satisfied customers” every time. Specificity signals authenticity. Generality signals marketing copy.
6. A Form That Doesn’t Frighten People
Reducing a form from 11 fields to 4 produces a 120% increase in completions on average. The relationship between form fields and conversion rate is not linear: adding a 6th field hurts less than adding a 3rd.
But every unnecessary field costs you leads. Name, phone number, and email address are almost always enough to qualify a Google Ads lead. Everything else can be collected during the sales conversation.
The Message Match Audit: How to Check Your Own Campaigns
Most conversion problems on Google Ads landing pages stem from a message mismatch that no one has audited. Here’s a systematic process to check every page in your account.
Step 1: Export your ad groups and top keywords. In Google Ads, go to Keywords and export the top 20 keywords by spend. These are the queries driving the most traffic and the most cost.
Step 2: Pull the corresponding ad copy. For each keyword, identify which ad is showing most often. Note the headline 1 and description 1 for each. These contain the primary promise your visitor is responding to when they click.
Step 3: Check the landing page headline against the ad copy. Open each landing page URL. Read the H1. Ask: if someone read the ad, then landed on this page, would the H1 feel like a direct continuation of the same conversation? Score each page as Match, Partial Match, or Mismatch.
Step 4: Prioritize Mismatches by spend. Sort your mismatch list by keyword spend. The highest-spend mismatches are your biggest conversion leaks. Fix those first.
Step 5: Fix one at a time and measure. Change the headline to match the ad copy. Don’t change anything else yet. Run for two weeks. If CVR improves, you’ve confirmed message match was the issue. Then move to the next fix.
A page converting at 4% overall might convert at 7% for the one campaign it was designed for and 2% for the four campaigns it wasn’t designed for. The blended 4% looks above median. The 2% on four campaigns is below the benchmark and completely avoidable. The message match audit surfaces that invisible problem.
Before and After: What a Google Ads Landing Page Actually Needs
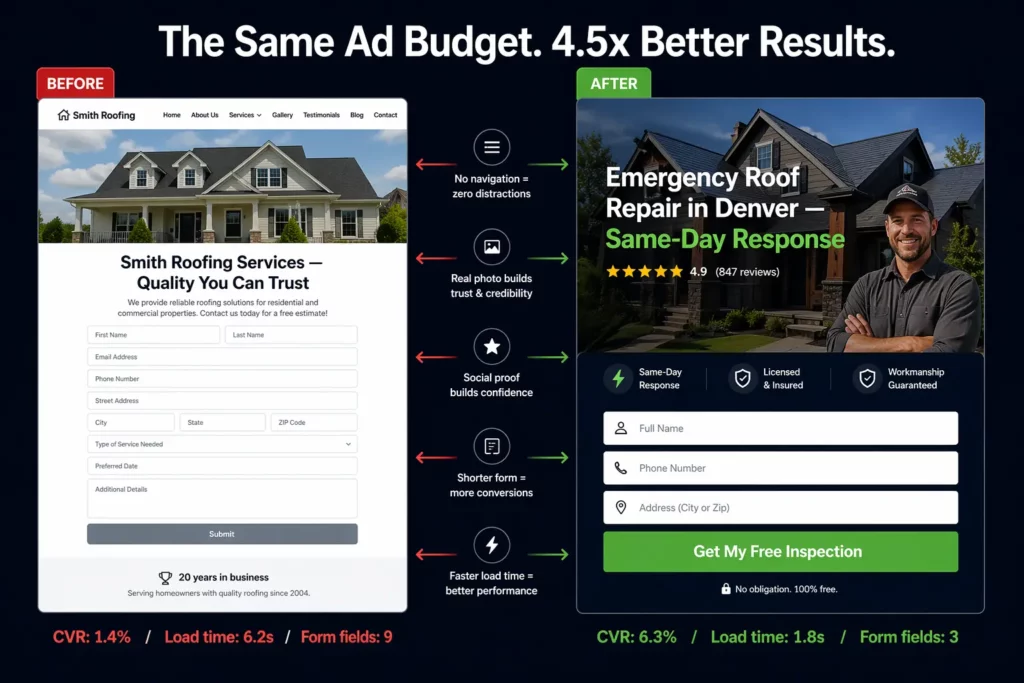
The fastest way to understand what separates a high-converting Google Ads landing page from a low-converting one is to see them side by side. Here’s a before-and-after for a roofing company running local search campaigns.
Before: The Underperforming Page
Headline: “Smith Roofing Services — Quality You Can Trust”
Navigation: Full menu with About, Services, Gallery, Blog, Contact
Hero image: Stock photo of a generic house
Form: 9 fields, including “How did you hear about us?” and “Preferred contact time”
Social proof: “Over 20 years in business” (below the fold)
CTA: “Submit”
Mobile load time: 6.2 seconds
Conversion rate: 1.4%
What’s wrong: The headline doesn’t match the ad (“Emergency Roof Repair Denver”). Navigation gives visitors 6 exit opportunities before they read a word of copy.
The stock photo signals “national aggregator”, not “local roofer.” Nine form fields at the top of the funnel. Social proof is invisible unless you scroll. “Submit” tells the visitor nothing about what they get.
Six-second load time means a significant portion of mobile visitors never see the page at all.
After: The Optimized Page
Headline: “Emergency Roof Repair in Denver — Same-Day Response”
Navigation: Removed entirely
Hero image: Photo of an actual completed job in Denver with the homeowner visible
Form: 3 fields: Name, Phone, Address
Social proof: “⭐⭐⭐⭐⭐ 4.9 stars from 847 Denver homeowners” above the fold
CTA: “Get My Free Inspection”
Mobile load time: 1.8 seconds
Conversion rate: 6.3%
What changed and why it worked: The headline now directly mirrors the search query. Removing navigation eliminated all exit opportunities except the CTA.
The local photo signals a genuine local presence. Three fields reduced friction dramatically. Moving social proof above the fold means visitors see credibility before they see the ask.
“Get My Free Inspection” frames the CTA as something the visitor wants, not something they’re doing for you. Faster load time means mobile visitors actually see the page.
The same ad budget. The same keywords. 4.5x better conversion rate from landing page changes alone.
How to Structure a Google Ads Landing Page
Above the Fold
The hero section determines whether a visitor stays or bounces. It needs to do five things in the first three seconds: confirm the message matches the ad, state the primary benefit clearly, establish credibility with one trust signal, present the CTA, and load quickly enough that visitors actually see it.
Keep headlines under eight words where possible. “Get a Free Roof Inspection in 24 Hours” beats “Smith Roofing Services, Serving Denver Since 1998” because it answers the visitor’s question immediately: what’s in it for me, right now?
The Body
Below the fold is where you handle objections. What makes you different from the other five companies running ads on this keyword? Why should someone trust you with their contact information? What happens after they fill out the form?
Structure the body around the visitor’s decision-making process. Lead with benefits, follow with proof (testimonials, case studies, specific numbers), then close with the CTA again. Visitors who scroll to the bottom are your most interested visitors. Give them a reason to act before they leave.
The CTA
“Submit” is the worst CTA button phrase you can use. It describes what the visitor is doing for you, not what they’re getting. “Get My Free Quote,” “Check Availability,” “See If I Qualify,” and “Book My Free Call” all outperform generic submit buttons because they frame the action as a benefit.
Test your CTA copy. Changing a single button from “Get Started” to “Get My Free Estimate” consistently yields measurable lift in conversions with no design work required.
Google Ads Landing Pages by Campaign Type
Search Campaigns
Search traffic is the highest intent traffic available. Create a dedicated landing page for each ad group, not each campaign.
If you’re running separate ad groups for “emergency plumber” and “bathroom renovation,” those visitors have different needs and levels of urgency. The same landing page underserves both.
Use the primary keyword from the ad group in your H1. This reinforces message match and signals relevance to Google’s QS algorithm.
Performance Max Campaigns
In 2026, Google’s AI Max and Performance Max use landing page content to inform text customization and ad assembly.
Tight alignment between landing page copy and campaign assets directly affects how well the AI can optimize your campaign.
Vague, generic landing pages give the algorithm less to work with. For Performance Max, treat your landing page as part of your asset library. Specific claims, clear value propositions, and strong social proof all feed the machine better than placeholder copy.
Local Service Campaigns
For local businesses (roofing, HVAC, plumbing, legal, home services), geographic specificity directly affects conversion rate.
Mentioning the city or region in the headline, using local testimonials with specific locations, and showing photos of actual jobs in the area all signal to a local visitor that you’re genuinely local, not a national aggregator.
Click-to-call is often the most important element on a local service landing page. Make the phone number large, prominent, and tappable on mobile. Consider a sticky header that keeps the phone number visible as the visitor scrolls.
Lead Generation Campaigns
For lead-generation verticals such as insurance, solar, mortgages, and home services, the landing page is where lead quality is determined.
Multi-step forms consistently outperform single-step forms. Starting with a low-commitment question before asking for contact details reduces the psychological barrier and improves both volume and quality.
Quiz funnels take this further by routing different visitor types to different offers based on their answers.
Vertical-Specific Landing Page Breakdown
Roofing and Home Services
The primary objection in home services is trust. Will this person actually show up? Will they do good work?
Landing pages that overcome this objection fastest are those with photos of actual completed jobs in the local area, named testimonials with addresses or neighborhoods, certifications, and license numbers visible, and a clear timeline for response.
The CTA should promise speed and ease. “Get My Free Estimate in 24 Hours” outperforms “Contact Us” because it answers both objections: you’ll respond fast, and there’s no commitment required.
Click-to-call should be visible on mobile without scrolling. Most roofing leads prefer to call rather than fill out a form.
Insurance and Medicare
Insurance landing pages have a compliance layer that most other verticals don’t. Claims must be accurate, disclosures must be present, and the page must not make promises the product can’t keep. Within those constraints, the highest-converting insurance pages use qualification-based CTAs (“See if you qualify,” “Check your eligibility”) rather than direct CTAs (“Buy now,” “Get a quote”).
Multi-step forms that collect intent before contact information produce significantly better lead quality in insurance. The visitor who answers four questions about their coverage needs before giving their phone number is a better lead than the one who filled out a generic form.
For Medicare specifically, quiz funnels that ask age, coverage status, state, and budget questions before the lead form produce leads that close at 2-3x the rate of single-step form pages.
Solar
Solar landing pages that perform well open with a local angle and a financial hook. “California homeowners are saving $2,340 per year on electricity” is more compelling than “Switch to solar today” because it makes the benefit specific and geographic.
An embedded savings calculator that lets visitors input their monthly electricity bill and see a personalized savings estimate consistently improves both lead volume and quality.
The highest-converting solar pages also proactively address the primary objection: “Does my home qualify?”
A pre-qualification step (What state are you in? Do you own your home? Is your monthly electricity bill over $100?) filters out unqualified visitors before the lead form, dramatically improving the quality of leads that get through.
B2B SaaS
B2B SaaS landing pages live or die on specificity. “The CRM for sales teams” converts worse than “Close 30% more deals without adding headcount.” The first is a category description. The second is a specific promise with a measurable outcome.
Social proof for B2B SaaS should include specific company names, specific outcomes, and specific roles where possible. “Sarah, VP of Sales at a 200-person SaaS company, reduced her team’s admin time by 40%” is more persuasive than “Trusted by thousands of businesses” because it lets the prospect see themselves in the result.
Median B2B SaaS conversion rate for Google Ads landing pages is 2.5-4%. Top-quartile performers consistently achieve 5-8% by matching messages and using specific social proof.
What to Test on Your Google Ads Landing Page
Run 2-3 A/B tests per month minimum. The highest-impact elements, in order of likely effect size:
Headline. The single highest-impact test available. A strong headline can lift conversions 250-300% compared to a weak one. Test problem-focused vs. benefit-focused, question format vs. statement, with and without geographic specificity.
CTA copy. High impact, low effort. Test generic vs. specific, first person vs. second person, urgency-based vs. benefit-based.
Form length. Test the minimum fields required to qualify a lead against your current form. Every field you remove increases the completion rate.
Social proof placement. Test star ratings and testimonials above the fold vs. below. Test specific named testimonials vs. aggregate review counts.
Hero image. For local campaigns, test real job photos vs. stock photos. The real photo almost always wins.
The Quality Score Connection: How Your Landing Page Affects What You Pay
Google assigns a Quality Score of 1-10 to each keyword in your campaign. A score of 7 or above means you’re paying below the market rate for that keyword.
A score of 3 or below means you’re paying a significant premium.
An advertiser with a Quality Score of 4 was paying $8.50 per click for a keyword, while a competitor with a Quality Score of 9 was paying $4.20 for the same keyword and ranking higher. Same auction, very different economics.
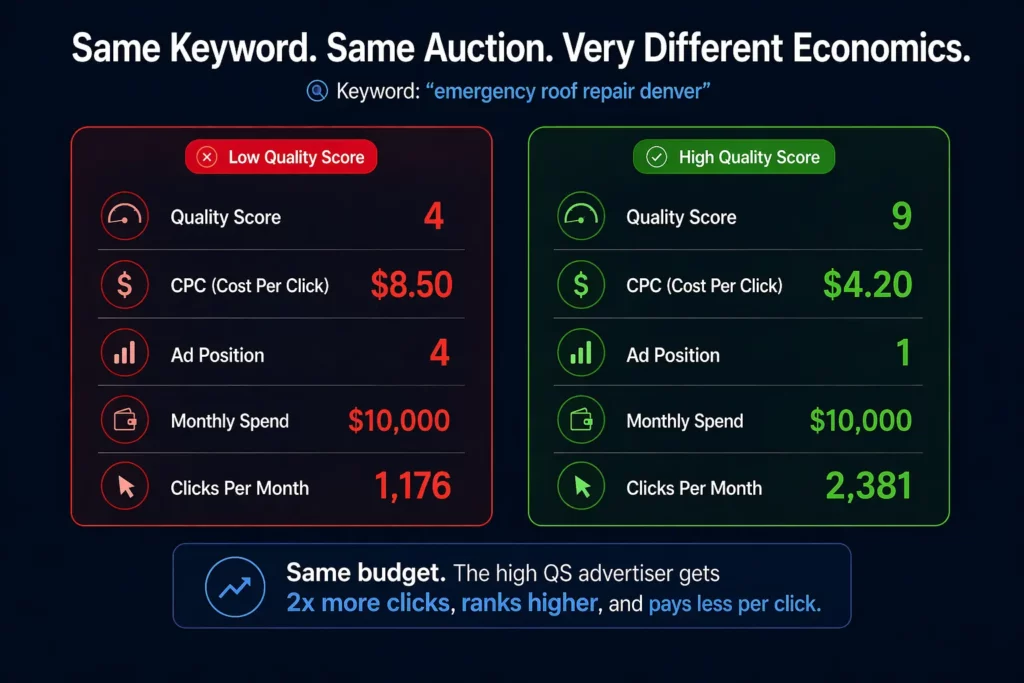
Landing page experience is one of the three components of Quality Score. Improving from “Below average” to “Above average” can reduce your CPC by 20-50% on competitive keywords.
On a campaign spending $10,000 a month, that’s $2,000-$5,000 in recovered budget with no change to your bids.
To check your landing page experience ratings: in Google Ads, go to Keywords, click Columns, and add the “Landing page exp.” column.
Filter for “Below average.” Those URLs are your immediate priorities. The fix is almost always one of four things: slow load time, poor message match, weak mobile experience, or thin content.
Use the calculator below to see exactly what improving your Quality Score would mean for your monthly spend.
Building Google Ads Landing Pages at Scale
Running Google Ads across multiple ad groups, campaigns, and verticals means you need multiple landing page variants. The standard advice to “create a dedicated landing page for each ad group” becomes impractical fast if building each page takes hours.
LanderLab’s PPC landing page builder is built for exactly this workflow.
Generate a landing page from a single prompt, clone and adapt it for different ad groups in minutes, and run split tests natively without needing separate testing software.
For campaigns running across solar, insurance, home services, and lead gen simultaneously, the ability to build and iterate fast is the actual competitive advantage.
The best Google Ads campaigns in 2026 are not won on bid strategy alone. They’re won on the quality of the page that receives the click.
Is Your Landing Page Ready? Use These Tools to Find Out
Use the checklist below to build your next Google Ads landing page right from the start. If you already have a page running, switch to the Diagnostic tab, answer six questions, and get a score with specific issues to fix.
Frequently Asked Questions: Google Ads Landing Pages
What is a Google Ads landing page?
A Google Ads landing page is a dedicated page that visitors arrive on after clicking your ad. Unlike a homepage or general website page, a Google Ads landing page is built around a single conversion goal that matches the specific promise made in the ad.
It has no navigation menu, no competing CTAs, and no distractions. Its only job is to convert the visitor who just clicked your ad into a lead or customer.
What should a Google Ads landing page include?
Every Google Ads landing page needs six things: a headline that matches the ad copy (message match), a single conversion goal with no competing links or navigation, a fast mobile load time under 2 seconds, social proof visible above the fold, a short form with 4 fields or fewer, and a benefit-driven CTA button (“Get My Free Quote”, not “Submit”).
For local campaigns, add geographic specificity in the headline and real job photos instead of stock images. For lead gen campaigns in high-CPL verticals, consider a multi-step form or quiz funnel to qualify intent before collecting contact information.
How do I improve my Google Ads landing page experience?
Check your Landing Page Experience rating in Google Ads under Keywords by adding the “Landing page exp.” column. If it shows “Below average,” the fix is almost always one of four things: slow mobile load time (compress images to WebP, remove unnecessary scripts), poor message match between ad and page headline, weak mobile experience (page built for desktop), or thin content that doesn’t match search intent.
Fix load time and message match first. These two changes alone typically move a “Below average” rating to “Average” or “Above average” within two to four weeks of Google re-crawling the page.
What is a good conversion rate for a Google Ads landing page?
It depends entirely on your vertical. For home services, 3.8% is average and 8%+ is top quartile. For B2B SaaS, 2.5-4% is average, and 5-8% is top quartile. For financial services, 8.4% is average. For legal services, 4.2% is average.
The cross-industry median sits around 3.2% for paid search traffic. If your conversion rate is below the average for your vertical, the most common cause is a message mismatch between your ad and page headline, too many form fields, or insufficient social proof above the fold.
Does my landing page affect my Quality Score?
Yes, directly. Landing page experience is one of the three components of Quality Score, alongside expected click-through rate and ad relevance. A low landing page experience rating reduces your Quality Score, which increases your CPC and lowers your ad position.
An advertiser with a Quality Score of 4 might pay $8.50 per click for a keyword while a competitor with a Quality Score of 9 pays $4.20 for the same keyword and ranks higher. Improving your landing page experience from “Below average” to “Above average” can reduce your CPC by 20-50% on competitive keywords.
How many landing pages do I need for Google Ads?
Ideally, one dedicated landing page per ad group, not per campaign. If you’re running separate ad groups for “emergency plumber” and “bathroom renovation,” those visitors have different needs and levels of urgency.
The same landing page underserves both and produces lower Quality Scores for each. In practice, start by creating dedicated pages for your highest-spend ad groups first.
A page converting at 4% overall might convert at 7% for the one campaign it was designed for and 2% for the four campaigns it wasn’t designed for. The message match audit in this article shows you how to identify which ad groups need their own page.
What’s the difference between a landing page and a website for Google Ads?
A website is built for exploration. It has navigation, multiple pages, and serves a range of visitor intents.
A Google Ads landing page is built for a single action. It has no navigation, one CTA, and serves only the visitor who clicked a specific ad with a specific intent.
Sending Google Ads traffic to your homepage instead of a dedicated landing page typically reduces conversion rates by 40-70% because the homepage creates a message mismatch and gives visitors too many ways to leave without converting. The homepage is where people learn about your business. The landing page is where they decide to become a customer.
Should I use the same landing page for all my Google Ads campaigns?
No. Using the same landing page for all campaigns is one of the most common and costly mistakes in paid search. A page converting at 4% overall might be converting at 7% for the campaign it was built for and 2% for everything else.
Each ad group with significant spend should have a landing page whose headline directly matches the primary keyword and ad promise for that group.
For Performance Max campaigns specifically, Google’s AI uses landing page content to assemble ad creative. Sending all campaigns to the same page gives the algorithm less to work with and typically produces worse results than campaign-specific pages.
The Bottom Line
A Google Ads landing page is not a webpage that happens to receive paid traffic. It’s a conversion system designed around a specific visitor with a specific intent who arrived from a specific ad. Every element on the page should serve that visitor’s decision-making process.
Get the message match right. Remove navigation. Speed the page up. Shorten the form.
Test the headline. Check your Quality Score. Those six actions, applied systematically, will move your conversion rate more than any bid adjustment or audience refinement you can make inside the Google Ads interface.
The traffic is already there. The question is whether your landing page deserves it.


